Fig. 6.

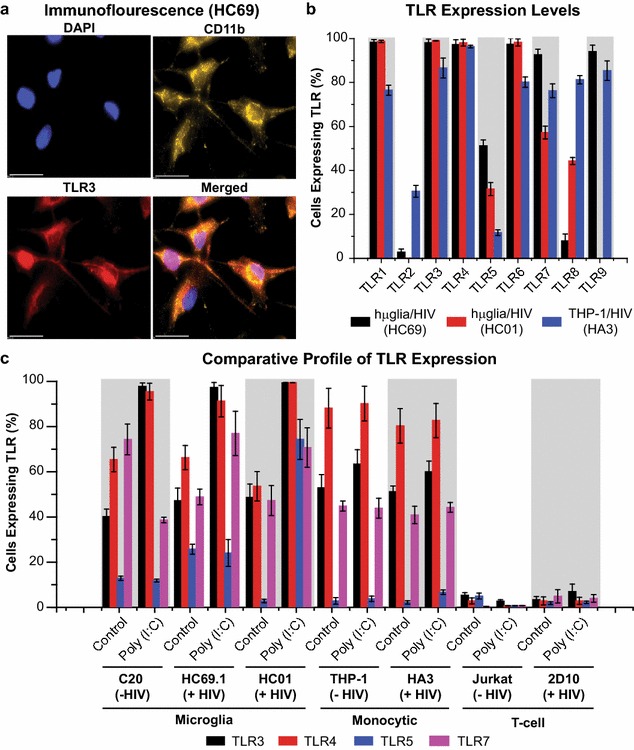
TLR expression on hµglia/HIV (HC69) and (HC01) cells. a Expression of TLR3 on clone HC69 by immunofluorescence. Cells were cultured, fixed, and immunostained with either anti-CD11b (green) or anti-TLR3 (red) conjugated antibodies. Nuclei were stained with DAPI (blue). Merged images of nuclei, CD11b and TLR3 are indicated. b Flow cytometry analysis quantification of surface expression of TLR1–9 on hµglia/HIV (HC69; black bars) and (HC01; red bars) cells. Cells were incubated with antibodies against TLR1–9, or corresponding isotype control. THP-1/HIV (HA3) cells (blue bars) were used as control. c Surface expression of TLR3, 4, 5, and 7 on indicated cell lines. Serum-starved cells were untreated or treated with 100 ng/mL of poly (I:C) prior to incubation with antibodies against these TLRs, or corresponding isotype control. Error bars represent the standard deviation of three or more experiments
