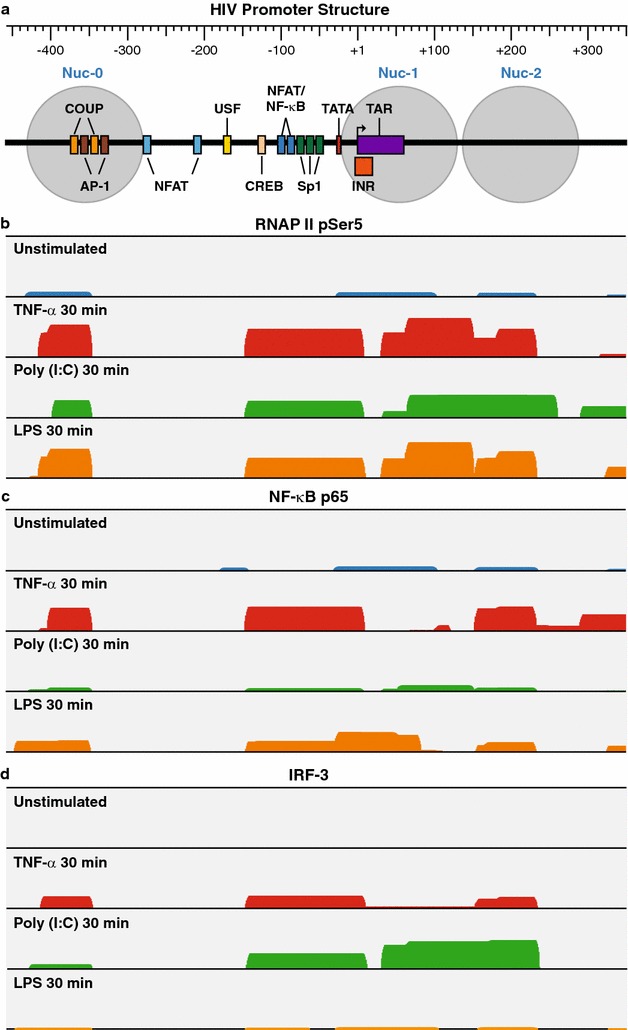
Fig. 9.

Chromatin immunoprecipitation assays showing the association of RNAP II (pSer5), NF-kB p65 and IRF3 with the HIV LTR. HC69 cells were untreated or treated with TNF-α (10 ng/mL), poly (I:C) (100 ng/mL) or LPS (10 ng/mL) for 30 min. DNA–protein complexes were extracted from formaldehyde-crosslinked cells. a Schematic representation of the HIV promoter region. b Histograms of sequence reads mapping to the HIV LTR representing the distribution and relative abundance of RNAP II pSer5, c p65, d IRF3
