Figure 1.
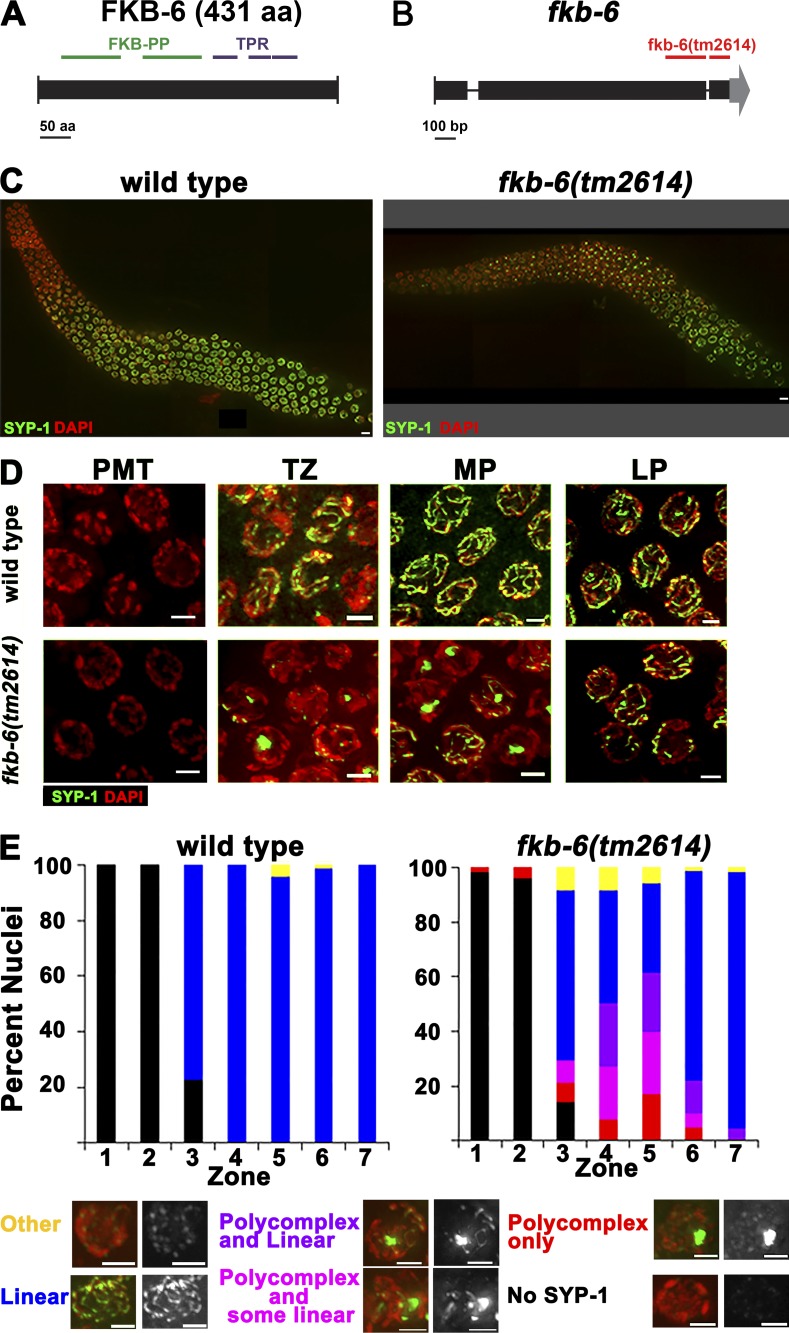
PC formation of SYP-1 proteins in fkb-6(tm2614) mutant germline. (A) C. elegans FKB-6 protein mapped with its protein domains. (B) Schematics of the fkb-6 gene with the position of the tm2614 deletion. (C) Images of full-length gonad stained with SYP-1 (central region, green) and DAPI (false-colored red) of the genotypes indicated. Images are z-stack projections of half the germline. (D) Representative images of SYP-1 staining in PMT, TZ, MP, and LP. Images are projections of a z-stack halfway through the nuclei. (E) Quantification of SYP-1 staining of wild-type and fkb-6 mutants. Scoring was divided into six categories, as indicated at the bottom. Representation of zones in terms of meiotic stage are as follows: zones 1 and 2, PMT (mitotic nuclei); zone 3, mostly TZ and some PMT; zone 4, mostly EP; zones 5 and 6, MP; and zone 7, LP. n nuclei: wild type = 657 and fkb-6 = 621. Bars: (A) 50 aa; (B) 100 bp; (C) 5 µm; (D and E) 2 µm.

