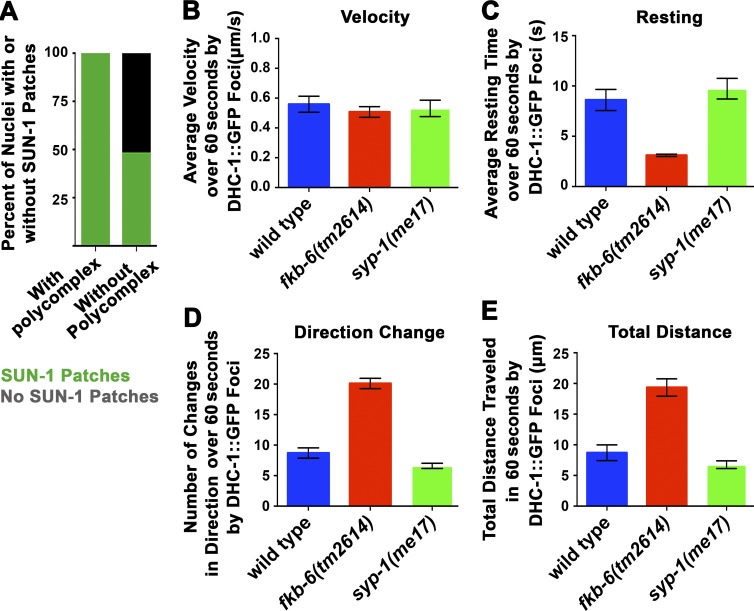
Figure 6.
fkb-6(tm2614) mutants show decreased resting time of DHC-1 foci between movements. (A) Percentage of nuclei with SUN-1 patches in nuclei that do and do not show PC formation in fkb-6(tm2614) mutants. n nuclei: fkb-6(tm2614) mutants = 387. (B) Mean velocity of DHC-1 patches. (C) Resting time of DHC-1 patches. (D) Change in direction of DHC-1 patches. (E) Total distance traveled by DHC-1 patches in wild type, fkb-6(tm2614), and syp-1 mutants. Error bars in B–E are SEM; n nuclei = 10 for all.

