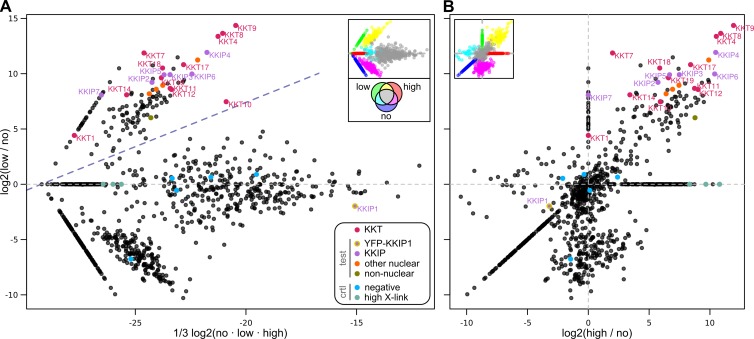
Figure 4.
Reversible cross-linking shows that KKIP1 interacts with KKTs. (A) Label-free semiquantitative mass spectrometry showing relative enrichment of proteins under conditions of “low” cross-linking against total intensity across all samples. (B) Enrichment under “low” versus “high” cross-linking. Signals from KKTs as well as 11 test and 8 control “hypothetical” proteins localized in this study are highlighted. For display, intensity of proteins not detected for a specific condition are set to an arbitrary minimum value. Insets show positions in the main plot of sets found under specific combinations of conditions, colored as demonstrated by the inset Venn diagram. Intensities and relative enrichment for all 935 nonredundant trypanosome proteins detected are presented in Table S3.

