Figure 6.
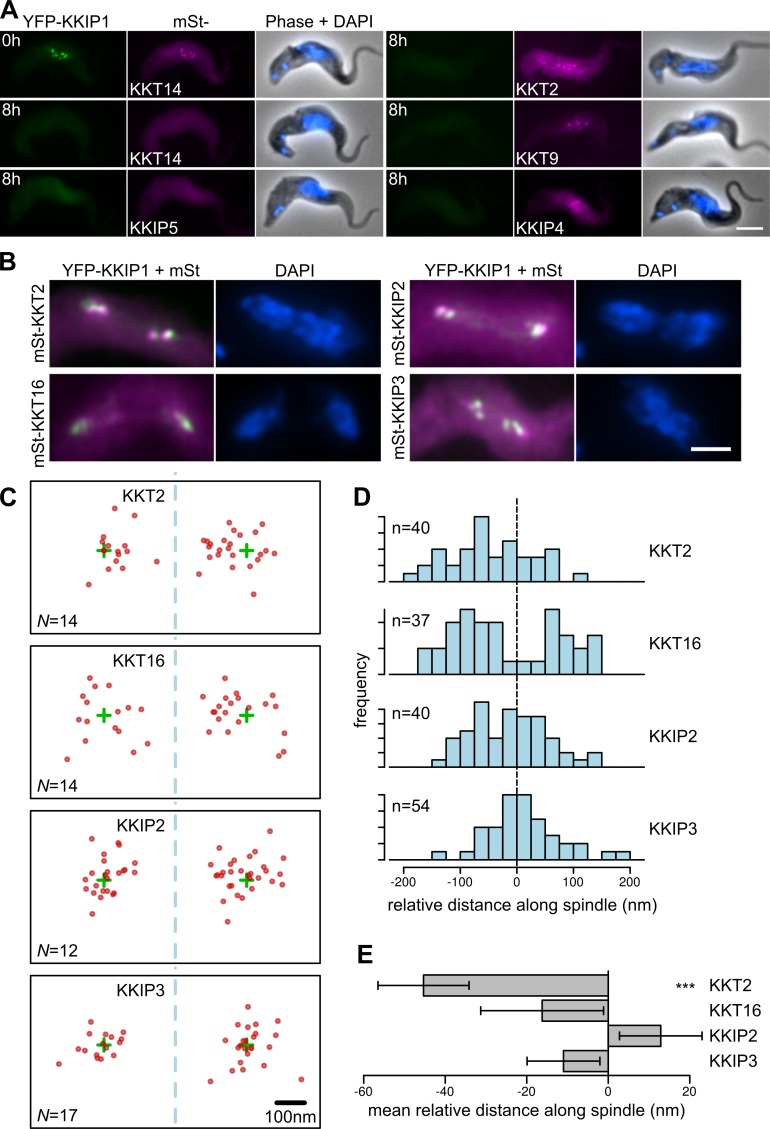
KKIP1 is an outer kinetochore protein. (A) Localization of KKT and KKIP components in cells at 0 or 8 h after induction of KKIP1 RNAi. (B) YFP-KKIP1 shows incomplete colocalization with predicted inner kinetochore components. (C) Subpixel positions of peak intensity for mStrawberry-tagged KKTs and KKIPs in anaphase cells. Positions of foci in individual cells (red dots) are shown relative to YFP-KKIP1 peak (green crosses) with spindle axis aligned to x. N gives number of independent spindles contributing to positions shown. (D) Distribution of relative positions along spindle axis. Negative values represent positions toward the mid-spindle. (E) Mean relative positions. Error bars show SEM (***, P < 0.001; Student's t test). Bars, 4 µm.

