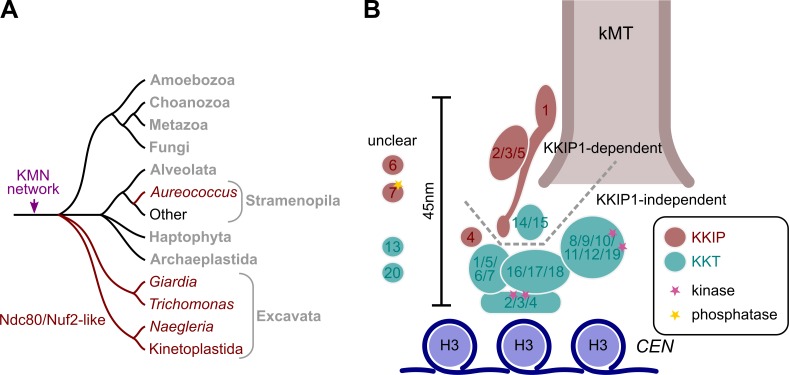
Figure 7.
The evolution of trypanosome kinetochores. (A) Schematic representation of the likely relationships between some of the major groups of eukaryotes showing the presence of Ndc80/Nuf2-like sequences. (B) Model for trypanosome kinetochore architecture based on interactions and temporal loading seen in Akiyoshi and Gull (2014) and work in this study. kMT, kinetochore microtubule.

