Figure 2.
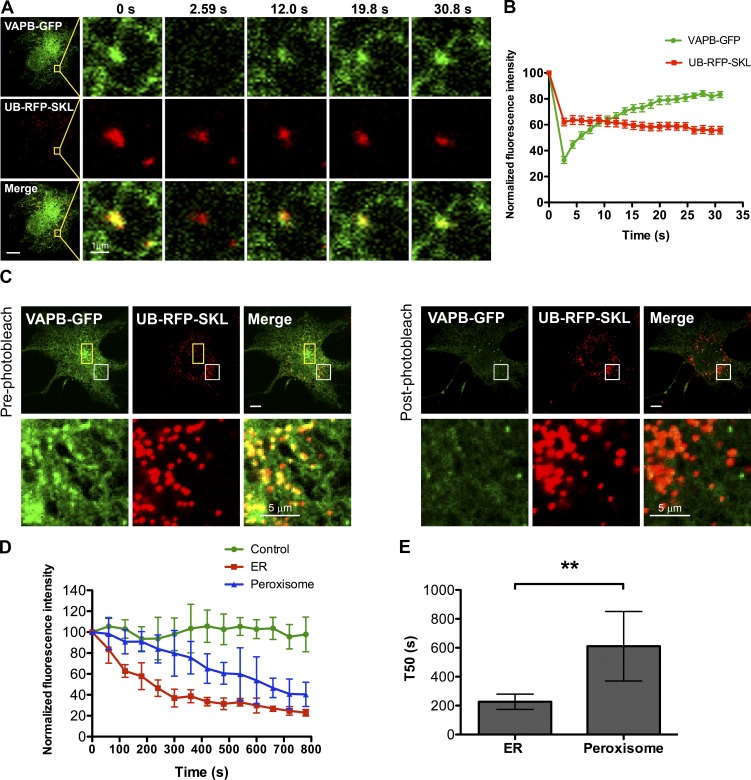
VAPB localizes in juxtaposition to peroxisomes on the ER. (A) FRAP assay performed in a COS7 cell transiently coexpressing VAPB-GFP and UB-RFP-SKL. Yellow squares indicate the photobleached ROI. (B) FRAP curves. Shown is the normalized fluorescence intensity of VAPB-GFP and UB-RFP-SKL punctate structures within each ROI. Mean ± SD (n = 12). (C) FLIP assay performed in a COS7 cell transiently coexpressing VAPB-GFP and UB-RFP-SKL in a yellow rectangular ROI. Shown is the first frame before photobleaching (pre-photobleach) and the first image after repeated photobleaching (post-photobleach). The white boxes indicate the magnified area shown below each panel. Bars, 10 µm (or as indicated). (D) FLIP curves. Shown is the normalized fluorescence intensity of VAPB-GFP punctate structure juxtaposed to a peroxisome and that of ER-localized VAPB-GFP. The fluorescence intensity of VAPB-GFP in an adjacent cell from the same image serves as a control for imaging induced photobleaching. Mean ± SD (n = 6). (E) Bar graph illustrating the time taken by the ER localized VAPB-GFP and peroxisomal VAPB-GFP in D to drop to 50% of its original level (T50). Mean ± SD (n = 6). **, P < 0.01.

