Figure 3.
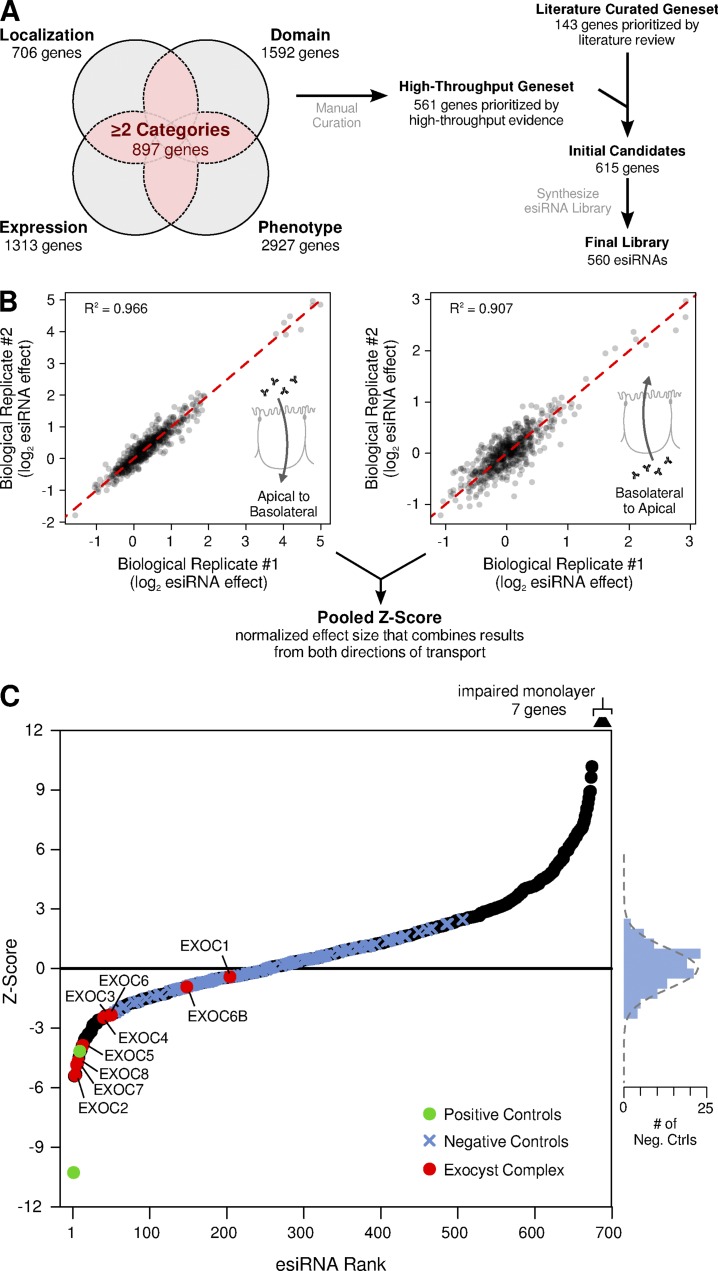
Targeted esiRNA screen for genes that regulate FcRn-mediated transcytosis. (A) Schematic of the strategy for candidate gene selection and esiRNA library synthesis. (B) Values of transcytosis (log2 esiRNA effect) for two out of three biological replicates for each esiRNA, plotted for both directions of transcytosis. The biological replicates displayed a high degree of reproducibility, with an R2 of 0.907 for basolateral-to-apical transport and 0.966 for apical-to-basolateral transport. Replicate values of transcytosis for each esiRNA and direction of transport were then pooled together and converted into an overall Z-score. (C) Ordered plot of the final pooled Z-scores. Positive controls (esiRNA against FcRn) are plotted in GREEN. Subunits of the exocyst complex are plotted in red. Negative controls are plotted as blue crosses, and their frequency of distribution is plotted to the right. The dotted gray line on the right shows the expected distribution of negative controls given the standard normal distribution.

