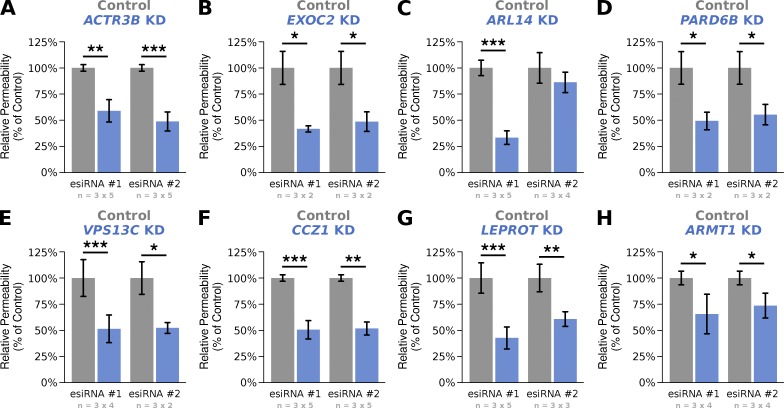
Figure 4.
Validation of eight genes selected from the top 15 ranked hits. (A–H) Transcytosis of Gluc-FcMN across MDCK monoloayers transfected with two independent esiRNAs against the indicated genes (blue columns). All experiments were normalized to the value of matched control monolayers transfected with nontargeting esiRNA (gray columns). Each experiment was conducted in triplicate on two to five independent days; the number of replicates and days are indicated below each bar graph in the form of n = (replicates per experiment) × (number of independent experiments). Bar graphs are reported as the weighted mean across experiments (see Materials and methods). Statistical significance was estimated using the Wilcoxon signed-rank test. *, P < 0.05; **, P < 0.001; ***, P < 0.0001.

