Figure 5.
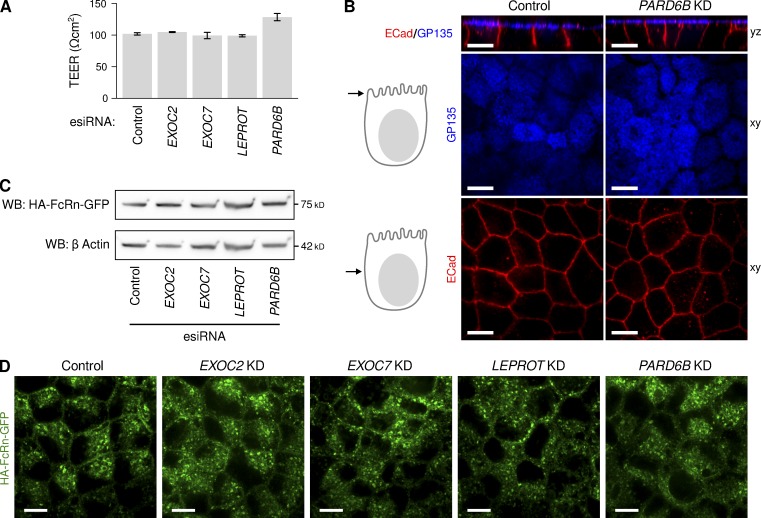
Characterization of MDCK-FcRn monolayers after depletion of EXOC2, EXOC7, PARD6B, and LEPROT. (A) Transepithelial electrical resistance, a measure of tight junction function, after esiRNA depletion of the indicated genes (n = 6–10 filters per esiRNA). (B) Immunolocalization of the apical membrane marker GP135 (blue) and lateral membrane marker E-cadherin (red) after esiRNA depletion of the polarity determinant gene PARD6B. Immunolocalization for the same markers are shown for monolayers depleted in EXOC2, EXOC7, and LEPROT in Fig. 4. (C) SDS-PAGE of total cell lysates and immunoblot for the HA-tagged FcRn-EGFP after esiRNA depletion of the indicated genes. Immunoblot for actin on same gel provides control for protein loading. Although the bands for FcRn and corresponding bands for actin have similar morphology, they are distinguished by antibody labeling and running at different positions in same gel. (D) Localization of HA-tagged FcRn-EGFP after esiRNA depletion of the indicated genes by direct confocal microscopy. Additional confocal sections for each gene are shown in Fig. S5. Bars, 10 μm.

