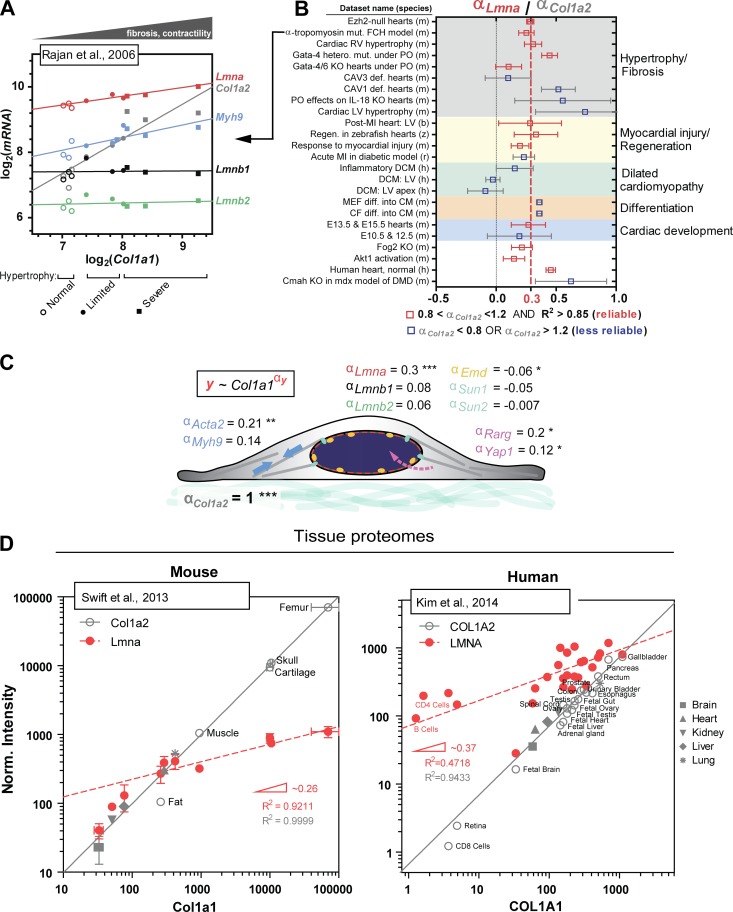
Figure 2.
Meta-analysis of universal stiffness-dependent scaling of lamin A/C and other nuclear envelope proteins. Published omics datasets of relevance were collected from various open-access databases (Barrett et al., 2013; Vizcaino et al., 2016), and as a first simple check for quantitative reliability, log–log plots of Col1a1 versus Col1a2 were generated for each dataset, because the two should in principle correlate well with each other as components of collagen’s stoichiometric structure. Only those datasets that gave Col1a2 scaling exponents (= slopes on a log–log plot) of αCol1a2 = 1 ± 0.2, with high R2 > 0.85, were selected for analysis, with the assumption that a robust correlation between Col1a1 and Col1a2 indicates minimal error arising from sample preparation and/or normalization. Such data provides an added advantage in that type I collagen content becomes a proxy for tissue stiffness (Swift et al., 2013). Once reliable datasets were identified, other proteins of interest (e.g., nuclear lamins) were plotted against Col1a1 to determine scaling exponents relative to that of Col1a2. (A) Representative transcriptomics dataset for mouse model of familial cardiac hypertrophy (FCH; Rajan et al., 2006) illustrating robust scaling between Col1a1 and Col1a2 (αCol1a2 = 0.95). Lmna and Myh9, among many other key mechanosensory proteins and genes, also correlate with Col1a1, whereas Lmnb1 and Lmnb2 remain constant. Samples were parsed into three groups: “normal,” “limited,” and “severe” hypertrophy. (B) The mean scaling exponent for Lmna (αLmna) normalized to that for Col1a2 (αCol1a2) obtained from ∼25 transcriptomics datasets is equal to <αLmna> = 0.3. Datasets span embryonic, fetal, and adult cardiac tissue samples from six different species (h, human; m, mouse; r, rat; z, zebrafish; b, boar; and d, dog) and at least five different disease models, including DCM, hypertrophy, fibrosis, and myocardial injury. Datasets that are deemed most quantitatively reliable with 0.8 < αCol1a2 < 1.2 and R2 > 0.85 are in red. CF, cardiac fibroblast; CM, cardiomyocyte; E, embryonic day; KO, knockout; LV, left ventricle; MEF, mouse embryonic fibroblast; MI, myocardial infarction; PO, pressure overload; RV, right ventricle. (C) Mean scaling exponents (αy) of several key proteins involved in nucleus mechanosensing. Col1a2, Lmna, Emd, Acta2, Myh9, Rarg, and Yap1 have statistically nonzero exponents. ***, P < 0.0001; **, P < 0.01; *, P < 0.05. (D) MS-based profiling of mouse (left) and human (right) tissue proteomes shows comparable scaling of LMNA with collagen I over several orders of magnitude (αLMNA ≈ 0.3), consistent with αLmna determined for heart transcriptomes.

