
Fig. 2.
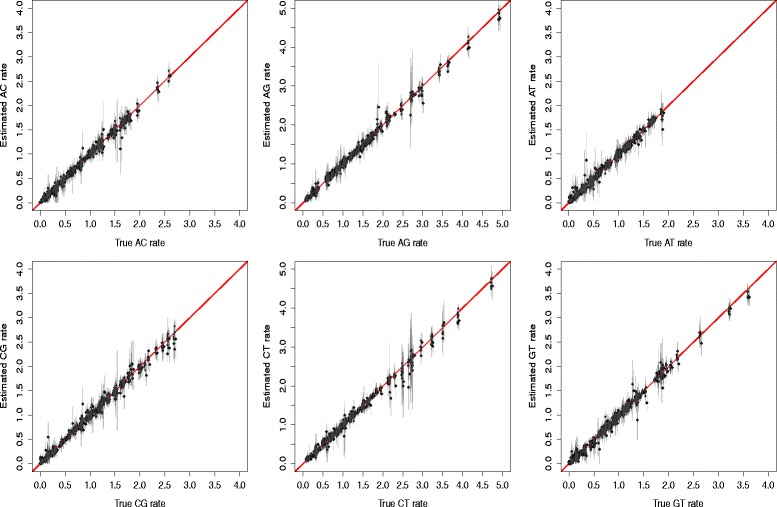
Accuracy of estimated substitution rates. True rates (horizontal) against estimated rates (vertical) in simulated data for 3 taxa. In reading order, rate AC, AG, AT, CG, CT and GT. Diamonds are for estimates when no rate heterogeneity was used to simulate the data, circles are for estimates with rate heterogeneity. Error bars represent 95% HPD intervals for each estimate