
Fig. 4.
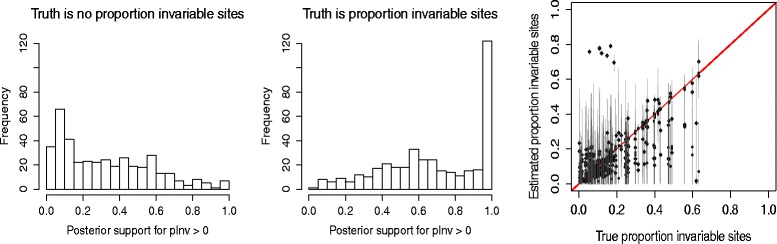
Accuracy of inference of proportion of invariant sites. Posterior probability for inclusion of a proportion of invariant sites when the data is generated without (left) and with (middle) invariant sites for 5 taxa. Right, empirical proportion invariant in alignment (horizontal) against estimated proportion of invariant sites (vertical) when a proportion invariable category is used to generate the data