
Fig. 6.
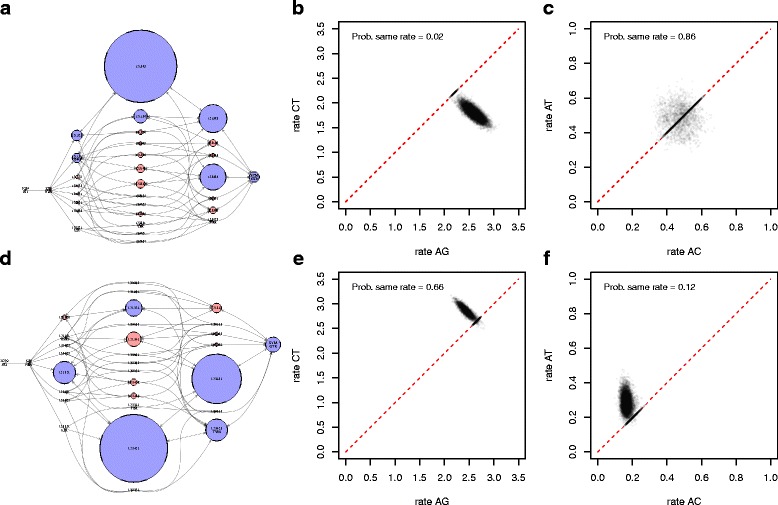
Posterior inference on HCV data. Like Fig. 5, but the data is split into two partitions, the first containing codon positions 1+2 (panel a, b and c) and second containing codon position 3 (panel d, e and f). The partitions support distinctly different site models. The left panels show the posterior distribution over models, the middle panel plots transition rates A⇔G versus C⇔T, and the right panel plots transversion rates A⇔C versus A⇔T