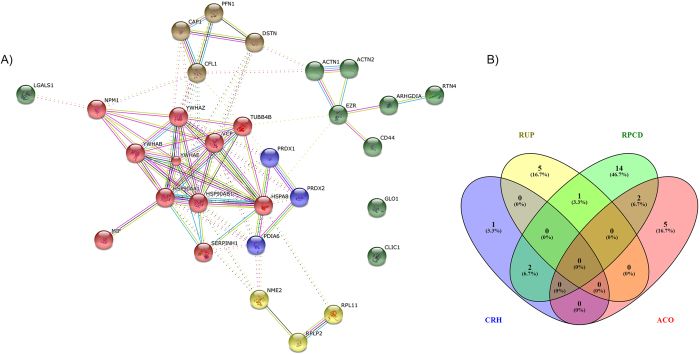
Figure 3. STRING Network analysis and Venn diagram of proteome analysis.
Network interaction of up-regulated proteins (2 fold and above) in MDA-MB-231 Upon PDT with diiodo-squaraine (20 μM) compared to Dark control by STRING analysis. Here we observed overlap of proteins to Regulation of programmed cell death (RPCD) to other pathways.

