
Fig. 4.
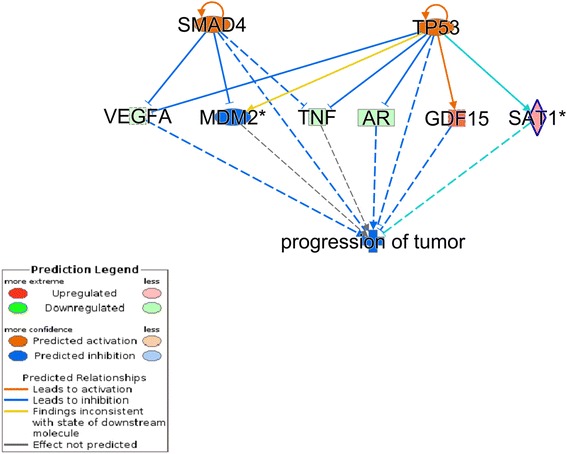
Network analysis of differentially expressed genes (DEGs) after 6 h of trabectedin treatment versus untreated control indicates an inhibition of tumor progression. Solid arrows indicate direct interaction, dashed lines indirect interaction. Green, down-regulated gene in the data set; red, up-regulated gene in the data set; orange, predicted activation inferred from the state of the present genes; blue, predicted inhibition inferred from the state of the present genes. Blue lines between genes indicate that the process leads to inhibition, while orange lines indicate activation. Grey lines indicate absence of any significant predicted effect