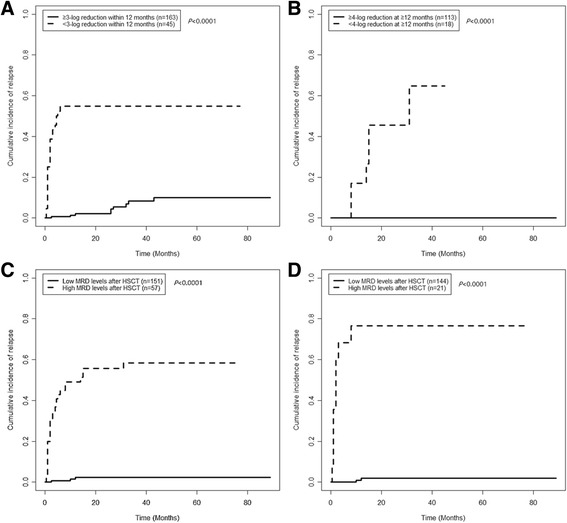
Fig. 4.

Comparisons of the CIR rates among patients with different MRD levels after HSCT. a The patients were grouped according to whether they achieved a ≥3-log reduction within 12 months. b The patients were grouped according to whether they achieved a ≥4-log reduction at ≥12 months. c All of the patients were grouped according to the dual cutoff values. d The patients with no intervention after HSCT were grouped according to the dual cutoff values
