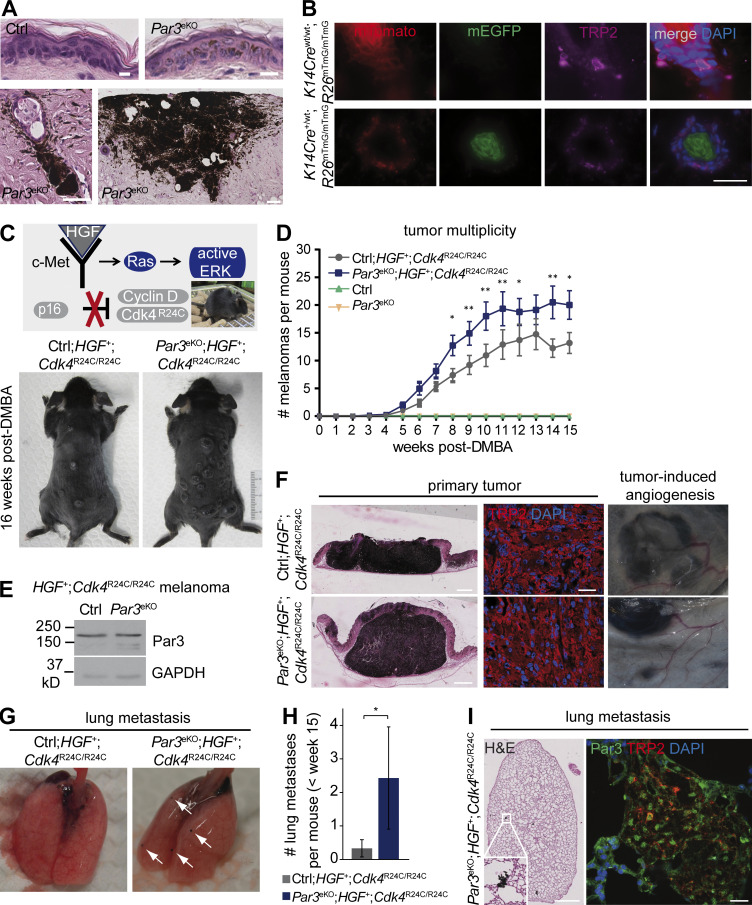
Figure 1.
Epidermal Par3 deletion results in elevated melanoma multiplicity and lung metastasis. (A) Epidermis of DMBA/TPA-treated control (ctrl) and Par3eKO mice, showing MC hyperplasia and melanoma in DMBA/TPA-treated Par3eKO mice. H&E staining of back skin cross sections is shown. Bars: (top) 10 µm; (bottom left) 50 µm; (bottom right)100 µm. Data are representative of one skin tumor experiment with control (n = 25) and Par3eKO (n = 27) mice. (B) Skin cross sections of mTmG dual-fluorescence reporter mice with and without K14Cre allele and simultaneous immunostaining for the MC marker TRP2. Note that K14Cre-mediated recombination as evident by switch from membranous red (mTomato) to green (EGFP) fluorescence does not occur in MCs. Bar, 25 µm. Data are represented from two independent experiments. n = 3 mice per group. (C) HGF;Cdk4R24C mice: an autochthonous mouse melanoma model for spontaneous melanoma. (Top) Single topical DMBA treatment (or single UV exposure) serves to accelerate and synchronize melanoma formation. (Bottom) Representative photographs of control and Par3eKO mice crossed to the HGF;Cdk4R24C melanoma model (Ctrl;HGF+;Cdk4R24C/R24C and Par3eKO;HGF+;Cdk4R24C/R24C) 16 wk after DMBA. (D) Tumor multiplicity in the melanoma model shown in C. Pooled data are depicted as mean ± SEM, with in total n (Ctrl;HGF+;Cdk4R24C/R24C) = 18 mice, n (Par3eKO; HGF+;Cdk4R24C/R24C) = 22 mice, n (control) = 5 mice, and n (Par3eKO) = 11 mice at the start of the experiment. P-values weeks 8–15 (left to right): *, P = 0.01242; **, P = 0.00931; **, P = 0.00125; **, P = 0.00456; *, P = 0.03295; NS, 0.07363; **, P = 0.00142; *, P = 0.01482; Ctrl;HGF+;Cdk4R24C/R24C vs. Par3eKO;HGF+;Cdk4R24C/R24C; multiple Student’s t tests. (E) Par3 and GAPDH immunoblots of protein extracts isolated from primary melanoma that developed in Ctrl;HGF+;Cdk4R24C/R24C and Par3eKO;HGF+;Cdk4R24C/R24C mice, demonstrating robust Par3 expression in melanoma that is unaffected by K14Cre-mediated recombination. Data are representative of three independent experiments. n = 3 biological replicates per group. (F) H&E staining of primary melanoma in control and Par3eKO melanoma mice. TRP2 immunohistochemistry of primary melanoma and macroscopically visible vascularization close to melanoma formed in these mice are shown. Bars: (left) 1 mm; (middle) 60 µm. Data are representative of at least three independent experiments (TRP-2 immunohistochemistry) or analyses of in total n (Ctrl;HGF+;Cdk4R24C/R24C) = 18 mice and n (Par3eKO; HGF+;Cdk4R24C/R24C) = 22 mice (H&E and tumor vascularization). (G) Lung metastasis in Ctrl;HGF+;Cdk4R24C/R24C and Par3eKO;HGF+;Cdk4R24C/R24C melanoma mice. Arrows indicate macroscopically visible metastases. (H) Quantification of macrometastases per lung in Ctrl;HGF+;Cdk4R24C/R24C (n = 12 mice) and Par3eKO;HGF+;Cdk4R24C/R24C (n = 7 mice) during melanomagenesis <15 wk after DMBA. The mean includes all mice analyzed irrespective of metastasis status. Incidence of lung metastasis: Ctrl;HGF+;Cdk4R24C/R24C, 16.7%; Par3eKO;HGF+;Cdk4R24C/R24C, 57.1%. Pooled data are depicted as mean ± SEM. *, P = 0.0436; Mann Whitney U test. (I) H&E (left) and TRP2 (right) immunostaining of melanoma metastases in lung. Bars: (H&E)100 µm; (immunofluorescence) 20 µm. Data are representative of two independent experiments. n = 3 biological replicates.

