Figure 6.
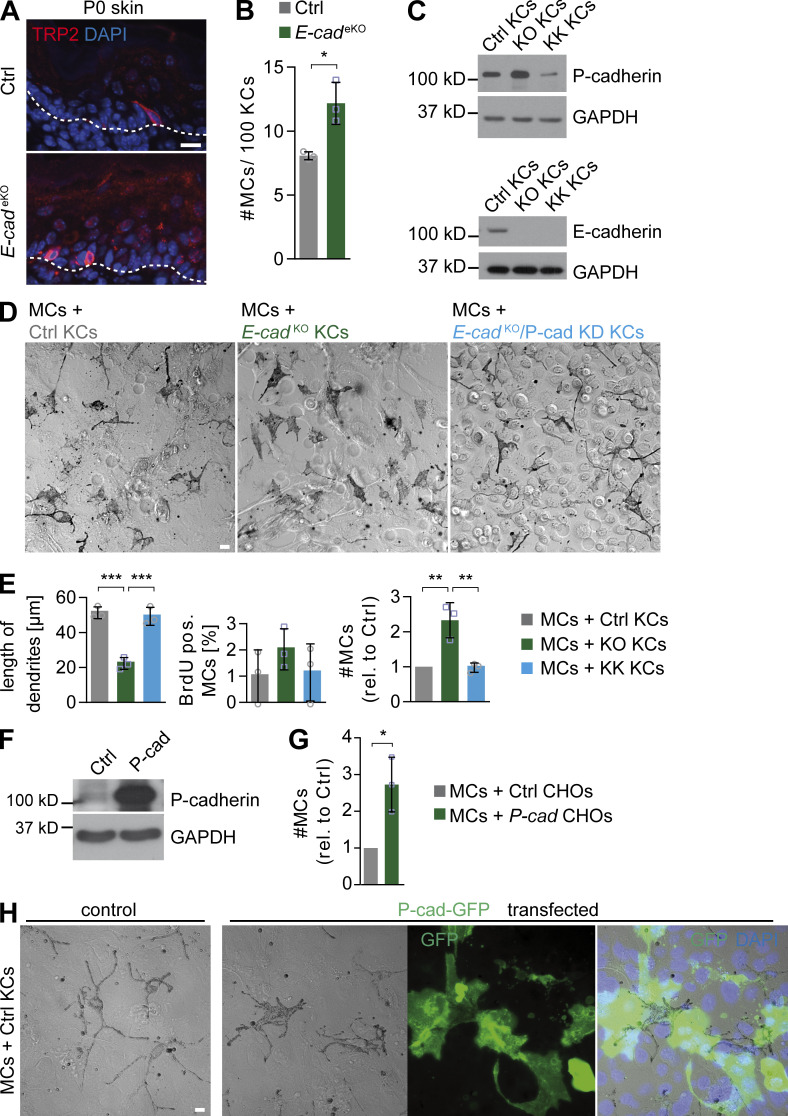
P-cadherin expression is sufficient to induce MC dedifferentiation and hyperproliferation. (A) TRP2 immunostaining of back skin cross sections of P0 control and E-cadeKO mice. Data are representative of three independent experiments. (B) Quantification of MC number in interfollicular epidermis of control and E-cadeKO P0 back skin. Data are pooled and represented as mean ± SD. n = 3 mice per group. *, P = 0.0133; Student’s t test. (C) Western blot analysis for P- and E-cadherin expression in control, E-cadKO (KO), and E-cadKO/P-cadKD (KK) KCs. Data are representative of three independent experiments. (D) Phase-contrast micrographs of MCs co-cultured with control (left), E-cadKO (middle), or E-cadKO/P-cadKD (right) KCs for 3 d at HC. Data are representative of three independent experiments. (E) Quantification of D (eight images per condition). Data are pooled and represented as mean ± SD. Dendritic length: n = 3 biological replicates per group; Ctrl versus KO: ***, P = 0.0003; KO versus KK: ***, P = 0.0005; one-way ANOVA with Tukey posthoc test. MC numbers: n = 3 biological replicates per group; Ctrl versus KO: **, P = 0.0038; KO versus KK: **, P = 0.0042; one-way ANOVA with Tukey posthoc test. (F) Western blot analysis for P-cadherin in control- and P-cadherin–expressing CHOs. Data are representative of two independent experiments. (G) Quantification of MC number co-cultured with control or P-cadherin overexpressing CHO cells for 4 d at HC (20 images per condition). Data are pooled and represented as mean ± SD. n = 3 biological replicates per group. *, P = 0.0159; Student’s t test. (H) Co-culture of MCs with control- or P-cadherin–GFP–transfected control KCs. Data are representative of two independent experiments. Bars: (A) 10 µm; (D and H) 20 µm. cad, cadherin; Ctrl, control; pos., positive; rel., relative.

