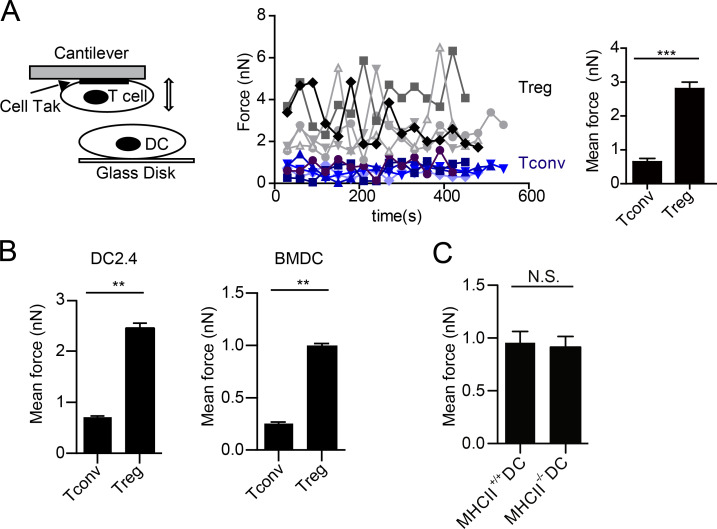
Figure 1.
T reg cells show strong binding to DCs. (A) A schematic diagram for AFM-SCFS assay setup (left) and SCFS force readings for T cells of indicated types adhering to DC2.4 cells (middle). Black or gray. T reg cell (5); other colors, T conv (5). All data points (dots in the middle) from five independent DC-T cell pairs for each condition, collected on the same day, were used to generate the bar graph to the right. The data presented (middle and right) are collectively considered as one experiment. Error bars are SEM. All the force graphs henceforth used the identical analysis to show all data points collected from all T–DC pairs of each condition in one experiment. For all subsequent figures involving SCFS, at least 14 force readings were collected for each T–DC pair, and a minimum of three independent T–DC pairs were performed and analyzed for each condition. (B) Mean forces of T cells of indicated types adhering to DC2.4 cells (left) or BMDCs (right). (C) Mean forces of T reg cells adhering to wild-type and MHC class II–deficient BMDCs. **, P < 0.01; ***, P < 0.001; N.S., not significant. Each panel is representative of at least five independent experiments.

