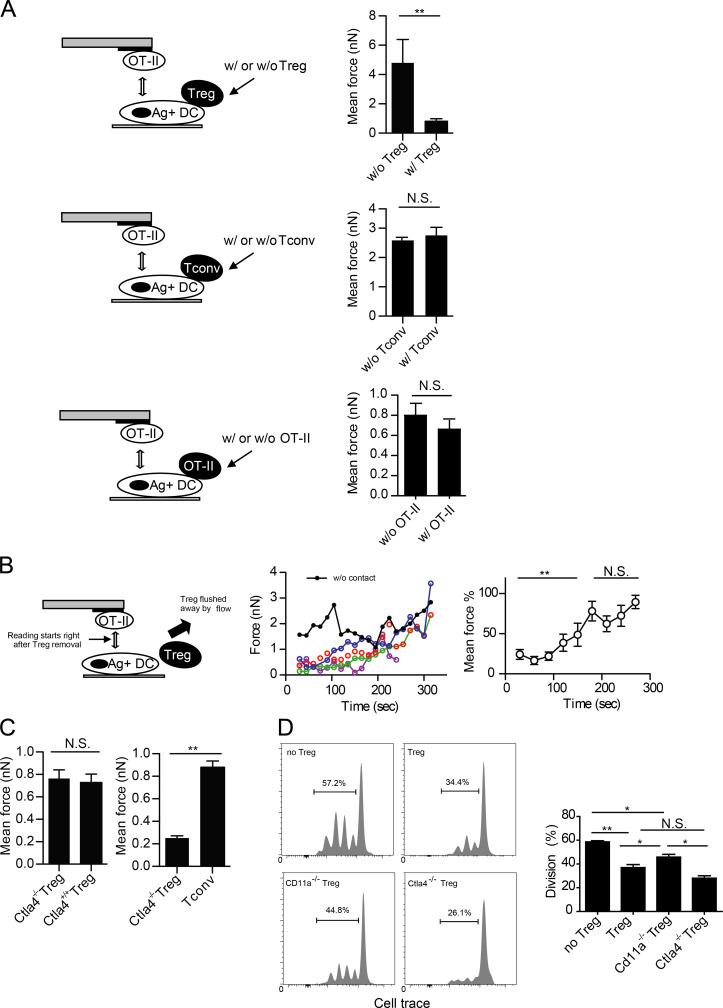
Figure 3.
T reg cell binding blocks T conv–DC interaction. (A) Adhesion between OT-II T cells and OVA-pulsed DC2.4 cells that were free or engaged by T reg cell (top), anti-CD3/anti-CD28–activated T conv (middle), or OVA-peptide–activated OT-II T (bottom) cells on the opposite side of the DC cell bodies. Shown are the triple-cell AFM assay setup (left) and mean OT-II–DC adhesion forces (right). Each is representative of four independent experiments. (B) Adhesion between OT-II T cells and OVA-pulsed DC2.4 cells that were newly freed from engagement by T reg cells. (left) The assay setup. (middle) SCFS force readings for one control DC without prior T reg cell engagement (black) and four newly freed DCs (other colors). Time zero is the moment when the T reg cell contact was relieved by flushing. (right) The control-normalized SCFS force readings for the newly freed DCs (middle), running-averaged with a bin size of two. Representative of three independent experiments. (C, left) Mean forces of wild-type or Ctla4−/− T reg cells adhering to DC2.4 cells. (right) Mean forces of OT-II T cells adhering to OVA-pulsed DCs that were engaged on one side of the cell body by Ctla4−/− T reg cells or T conv cells. (D, left) Wild-type, Ctla4−/−, and Cd11a−/− T reg cell–mediated suppression of OT-II T cell division. (right) Statistical analysis. Representative of three independent experiments. *, P < 0.05; **, < 0.01; NS, not significant.

