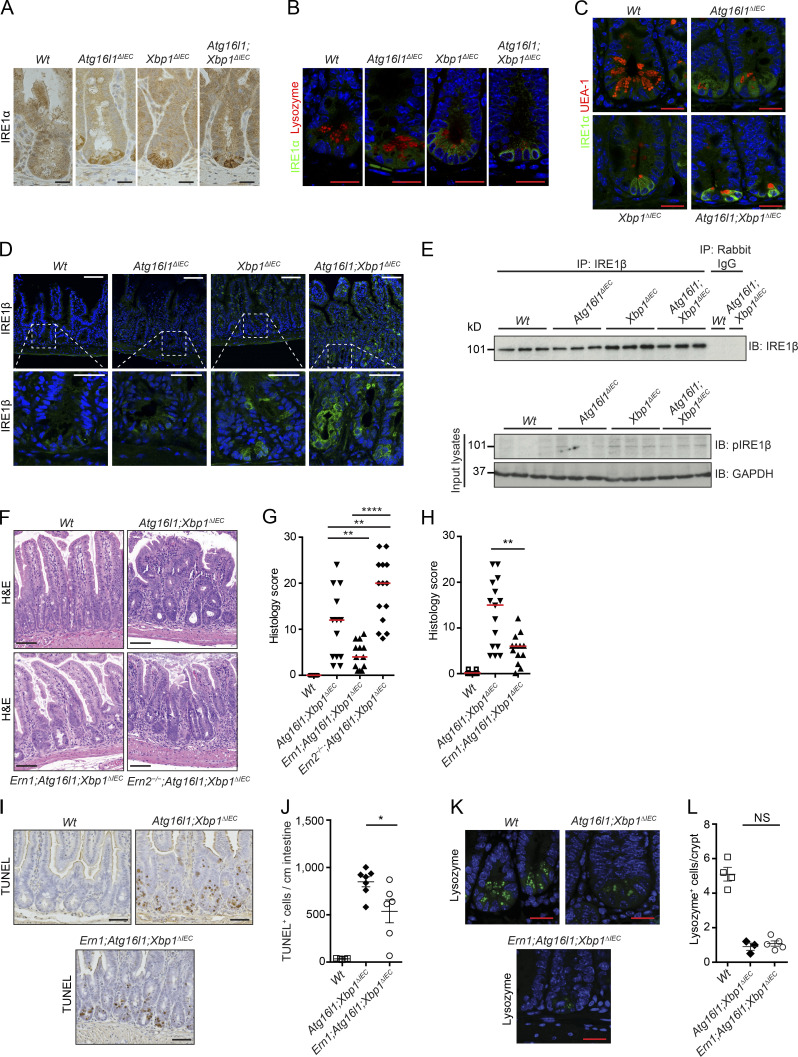
Figure 2.
IRE1α controls CD-like inflammation. (A) Representative images of IRE1α immunohistochemistry (brown) on ileal sections of 10-wk-old Atg16l1ΔIEC, Xbp1ΔIEC, and Atg16l1;Xbp1ΔIEC mice. n = 3. Hematoxylin is in blue. Bars, 20 µm. (B) Representative confocal images of IRE1α immunofluorescence (green) and Paneth cell–derived lysozyme (red) on ileal sections from the indicated genotypes at 10 wk of age. Note the perinuclear cytoplasmic IRE1α immunoreactivity of Paneth cells from Atg16l1ΔIEC mice that are lysozyme positive on the luminally oriented apex. n = 3. DAPI is in blue. Bars, 20 µm. (C) Representative confocal images of IRE1α immunofluorescence (green) and the Paneth and goblet cell–type–specific lectin UEA-1 (red) on ileal sections from the indicated genotypes at 10 wk of age. n = 3. DAPI is in blue. Bars, 20 µm. (D) Representative confocal images of IRE1β immunofluorescence (green) of the indicated genotypes at 10 wk of age. Note the specific IRE1β immunoreactivity of crypts (insets, bottom) and villus IECs from Atg16l1;Xbp1ΔIEC and Xbp1ΔIEC mice. DAPI is in blue. n = 3. Bars: (top) 50 µm; (bottom) 20 µm. (E) IRE1β immunoprecipitation (IP) and immunoblot (IB) as well as pIRE1β immunoblot in crypt lysates. n = 3. GAPDH was used as the loading control. (F and G) Representative H&E images (F) and their histological score (G) of 10-wk-old mice. n = 28/13/13/9. The median is shown. One-way ANOVA with Bonferroni’s correction was used. Bars, 100 µm. (H) Enteritis histology score of the indicated genotypes housed at the mouse norovirus–positive SPF animal facility (ZVTA) of the Medical University of Innsbruck. n = 12/15/13. The median is shown. Unpaired two-tailed Student’s t test was used. (I and J) Representative images of TUNEL-labeled IECs (brown; I) and quantification (J). n = 5/7/6. The mean ± SEM is shown. Mann–Whitney U test was used. Hematoxylin is in blue. Bars, 50 µm. (K and L) Representative confocal images of lysozyme immunofluorescence in crypt IECs (green; K) and quantification (L). n = 4/3/5. The mean ± SEM is shown. A Mann–Whitney U test was used. DAPI is in blue. Bars, 20 µm. *, P < 0.05; **, P < 0.01; ****, P < 0.0001.

