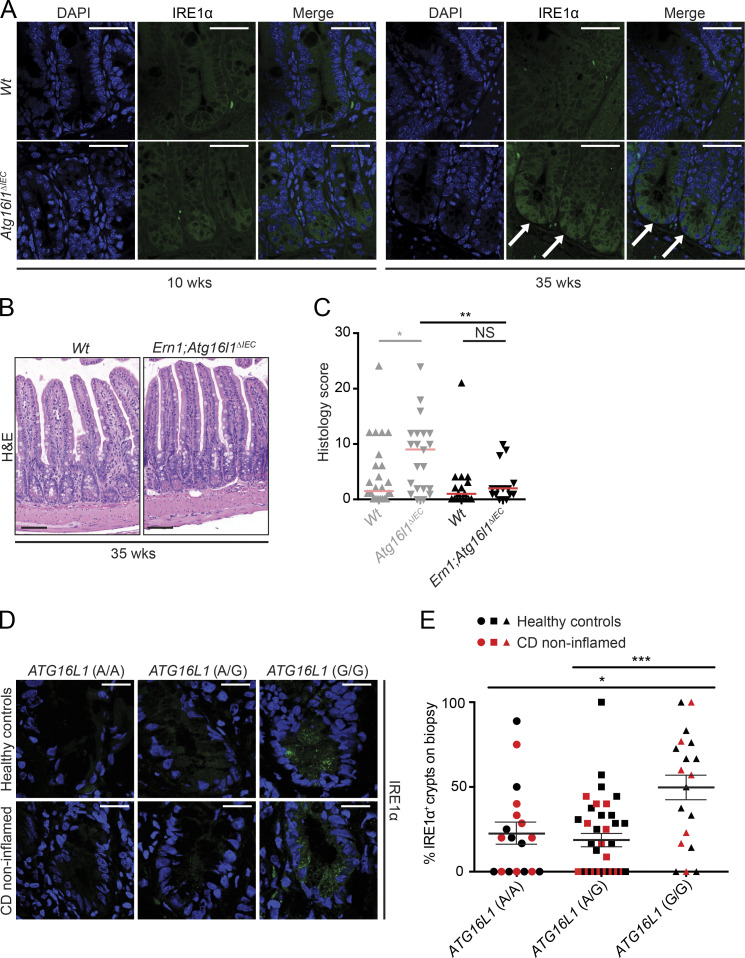
Figure 3.
IRE1α expression is increased in 35-wk-old Atg16l1ΔIEC mice and ATG16L1T300A patients and drives CD-like ileitis. (A) Representative confocal images of IRE1α immunoreactivity (green; white arrows) in 10- and 35-wk-old Atg16l1ΔIEC mice. n = 3. DAPI is in blue. Bars, 50 µm. (B) Representative H&E images of 35-wk-old Ern1;Atg16l1ΔIEC and Wt mice. Bars, 100 µm. (C) Enteritis histology scores of 35-wk-old Atg16l1ΔIEC mice (the identical scores are depicted in Fig. 1 C) compared with 35-wk-old Ern1;Atg16l1ΔIEC mice and their respective Wt controls. n = 25/21/19/15. The median is shown. A Mann–Whitney U test was used. (D) Representative IRE1α immunoreactivity (green) stratified by the ATG16L1 risk allele (AA/AG/GG; A, healthy allele; G risk allele) in healthy controls (n = 9/22/12) and noninflamed mucosa (n = 9/15/7) of CD patients. DAPI is in blue. Bars, 20 µm. (E) Quantification of IRE1α+ crypts shown in D in healthy controls (n = 9/22/12) and CD patients (n = 9/15/7) according to their ATG16L1 genotype (n = 18/37/19). Mean ± SEM is shown. One-way ANOVA with Bonferroni’s correction was used. *, P < 0.05; **, P < 0.01; ***, P < 0.001.

