Figure 4.
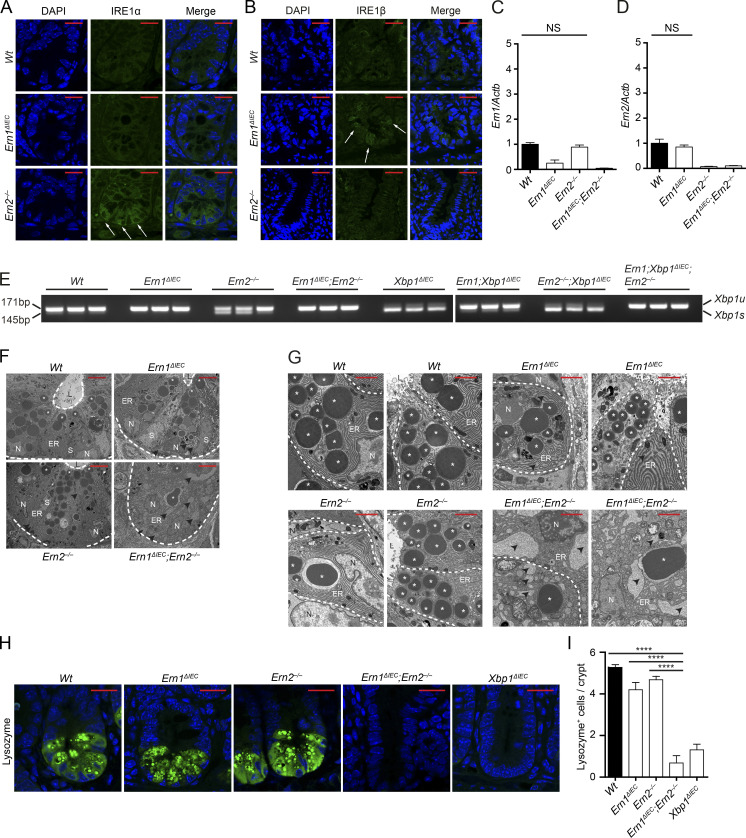
Cross-compensatory up-regulation of IRE1α and IRE1β maintains Paneth cell homeostasis. (A and B) Representative confocal images of IRE1α (A) or IRE1β (B) immunofluorescence (green) of the indicated genotypes at 10 wk of age. Note the cross-compensatory up-regulation of IRE1β and IRE1α in crypts of Ern1ΔIEC and Ern2−/− mice, respectively (white arrows). n = 3. DAPI is in blue. Bars, 20 µm. (C and D) Ern1 (C) and Ern2 (D) mRNA expression measured by qRT-PCR in ileal scrapings of the indicated genotypes normalized to Actb expression. n = 20/10/16/15. The mean ± SEM is shown. One-way ANOVA with Bonferroni’s correction was used. Note that IRE1α and IRE1β (encoded by Ern1 and Ern2) in Ern2−/− and Ern1ΔIEC mice, respectively, are not transcriptionally regulated. (E) Xbp1 splicing in crypt IECs from the indicated genotypes indicative of upstream activation of IRE1α/IRE1β. Note increased Xbp1 splicing in Ern2−/− crypts indicative of upstream activation of IRE1α (also see A), whereas IRE1β appears to have a minor function for Xbp1 splicing in Ern1;Xbp1ΔIEC mice which is absent in Ern1;Xbp1ΔIEC;Ern2−/−. n = 3. (F) High magnification transmission electron microscopy micrographs of ileal crypts depicting Paneth cells from the indicated genotypes. n = 2. Bars, 5 µm. Dashed lines denote crypt unit. (G) High magnification transmission electron microscopy micrographs of ileal crypts depicting Paneth cells from the indicated genotypes. n = 2. Bars, 2 µm. Dashed lines denote single Paneth cells. (F and G) L, lumen; N, nucleus; S, stem cell. White asterisks label Paneth cell granules. Note the absence of intact Paneth cell granules and the dilated ER lumen (black arrowheads). (H and I) Representative confocal images of lysozyme immunoreactivity (green; H) and quantification of lysozyme+ cells per crypt (I) on ileal sections of the indicated genotypes. n = 4/3/4/3/4. The mean ± SEM is shown. One-way ANOVA with Bonferroni’s correction was used. ****, P < 0.0001. DAPI is in blue. Bars, 20 µm.

