Figure 5.
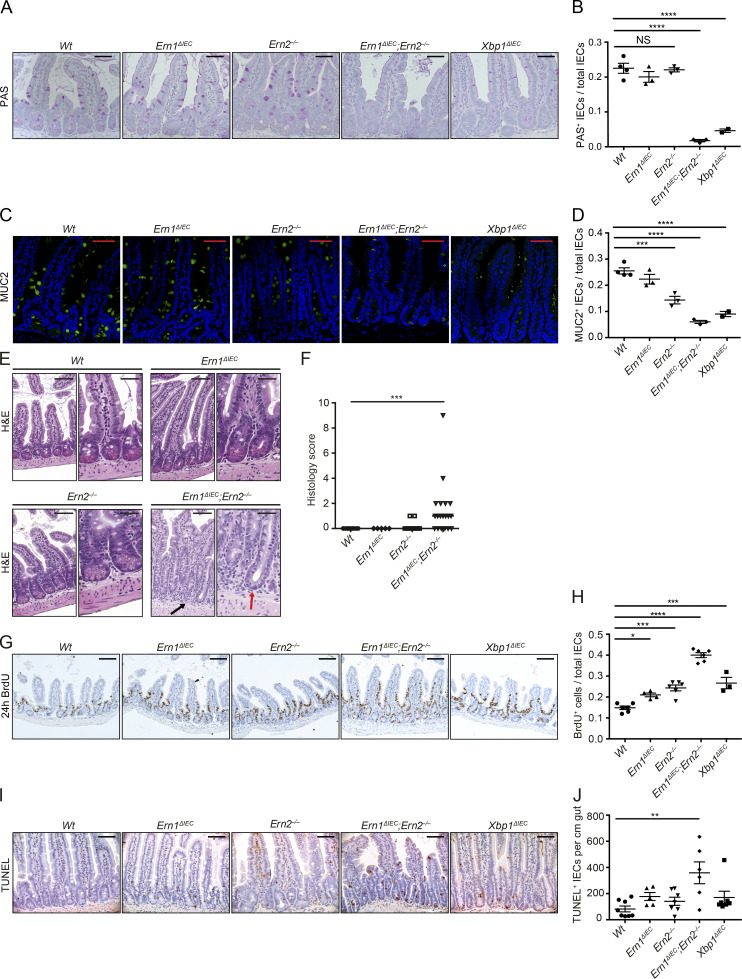
Cross-compensation of IRE1α and IRE1β maintains intestinal homeostasis. (A and B) Representative PAS staining on ileal sections from the indicated genotypes at 10 wk of age (A) with quantification of PAS-labeled IECs per total IECs along the crypt villus axis (B). Note the absence of PAS+ goblet cells in Ern1ΔIEC;Ern2−/− mice. n = 4/3/3/3/2. The mean ± SEM is shown. One-way ANOVA with Bonferroni’s correction was used. Hematoxylin counterstaining is in light blue. Bars, 50 µm. (C and D) Representative confocal images of MUC2 immunoreactivity (green) on ileal sections from the indicated genotypes at 10 wk of age (C) with quantification of MUC2+ goblet cells per total IECs along the crypt villus axis (D). Note the absence of MUC2+ goblet cells in Ern1ΔIEC;Ern2−/− mice. n = 4/3/3/3/2. The mean ± SEM is shown. One-way ANOVA with Bonferroni’s correction was used. DAPI is in blue. Bars, 50 µm. (E and F) Representative H&E images (E) of the indicated genotypes at 10 wk of age and their histological score (F). n = 10/5/17/19. The median is shown. A Mann–Whitney U test was used. Note the absence of eosinophilic Paneth cell granule (red arrow) and the surrounding basal infiltration of mononuclear cells in Ern1ΔIEC;Ern2−/− mice (black arrow). Bars: (left) 100 µm; (right) 50 µm. (G and H) Representative images of BrdU-labeled IECs (brown; G) from the indicated genotypes at 10 wk of age after 24 h of BrdU incorporation with quantification of BrdU+ IECs per total IECs along the crypt villus axis (H). n = 6/3/4/6/6. The mean ± SEM is shown. One-way ANOVA with Bonferroni’s correction was used. Hematoxylin counterstaining is in blue. Bars, 100 µm. (I and J) Representative images of TUNEL labeling (brown; I) and quantification of TUNEL+ cells per cm gut on ileal sections (J) of the indicated genotypes at 10 wk of age. n = 8/7/5/7/6. The mean ± SEM is shown. One-way ANOVA with Bonferroni’s correction was used. Hematoxylin counterstaining is in blue. Bars, 50 µm. *, P < 0.05; **, P < 0.01; ***, P < 0.001; ****, P < 0.0001.

