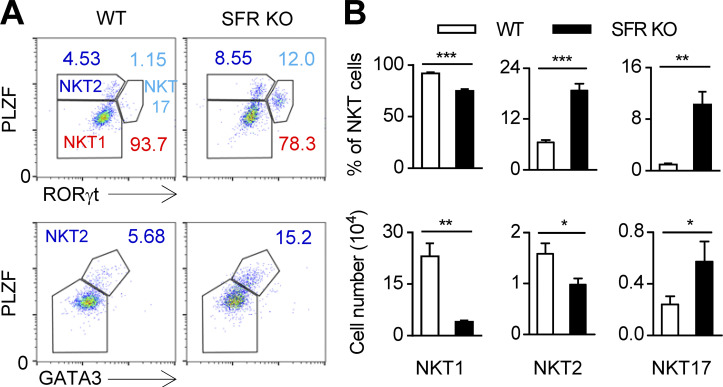
Figure 3.
SFR deficiency alters the composition of NKT cell subsets. (A and B) Representative flow cytometry plots (A) and percentages and absolute numbers (B) of NKT1 (PLZFlowRORγt−), NKT2 (PLZFhiRORγt−), and NKT17 (PLZFintRORγt+) or NKT2 (PLZFhiGATA3hi) of the gated CD3+CD1d-Tet+ NKT cell population in the thymus of the indicated mice. Data represent the mean ± SEM of five mice per group. *, P < 0.05; **, P < 0.01; ***, P < 0.001.

