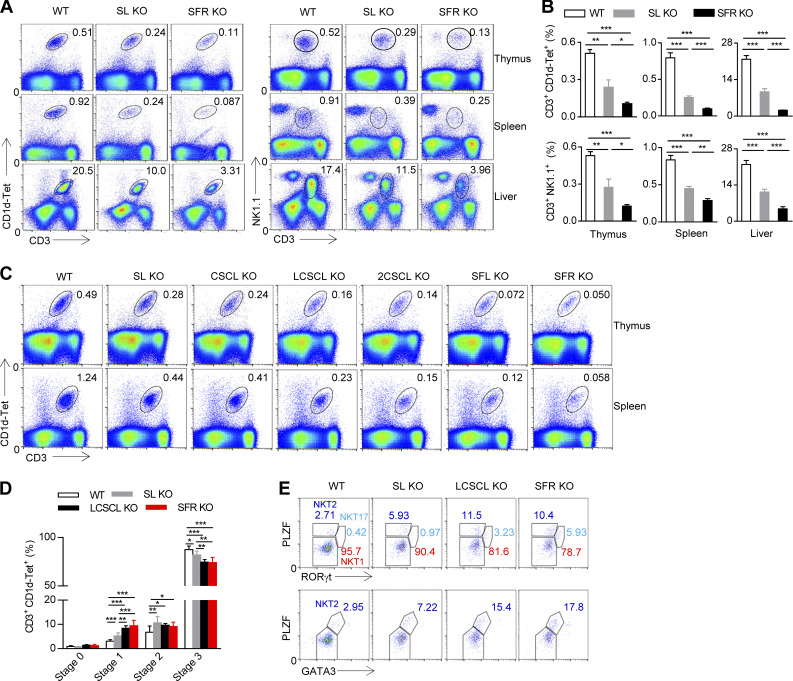
Figure 4.
Multiple SFR members participate in the process of NKT cell selection. (A and B) Representative flow cytometry plots (A) and percentages (B) of the CD3+CD1d-Tet+ NKT cell population or the CD3+NK1.1+ NKT cell population in the thymus, spleen, and liver from the indicated mice. The data represent the mean ± SEM of 5–10 mice per group. *, P < 0.05; **, P < 0.01; ***, P < 0.001. (C) Representative flow cytometry plots of the CD3+CD1d-Tet+ NKT cell population in the thymus of the indicated mice. 2CSCL KO, mice lacking 2B4, CRACC, SLAM, CD84, and Ly108; SL KO, mice lacking SLAM and Ly108; CSCL KO, mice lacking CRACC, SLAM, CD84, and Ly108; LCSCL KO, mice lacking Ly9, CRACC, SLAM, CD84, and Ly108; SFL KO, mice lacking Ly9, CRACC, CD48, SLAM, CD84, and Ly108; SL KO, mice lacking SLAM and Ly108. The data are representative of three experiments. (D) Percentages of NKT cells at four stages of development among the gated CD3+CD1d-Tet+ NKT cells in the thymus of the indicated mice. Data represent the mean ± SEM of three to seven mice per group. *, P < 0.05; **, P < 0.01; ***, P < 0.001. (E) Representative flow cytometry plots of NKT1, NKT2, and NKT17 cells of the gated CD3+CD1d-Tet+ NKT cell population in the thymus of the indicated mice. The data are representative of three experiments.

