
Fig. 1.
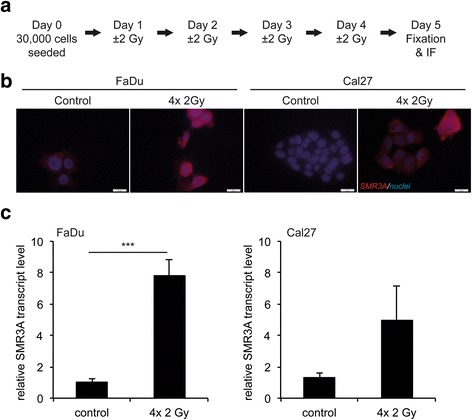
SMR3A expression in HNSCC cell lines after fractionated IR. a Schematic summary of the treatment protocol for fractionated IR. Prominent SMR3A expression in FaDu and Cal27 cells after fractionated IR (4× 2Gy) was demonstrated by immunofluorescence staining on protein level b (red signal) and by RQ-PCR on transcript level (c) Cell nuclei were counterstained with Hoechst H33342 (blue signal). Scale bars = 20 μm. Bars represent mean values ± SEM of two independent experiments measured in triplicates with quantification of LMNB1 transcript levels as reference gene. *** p ≤0.0005