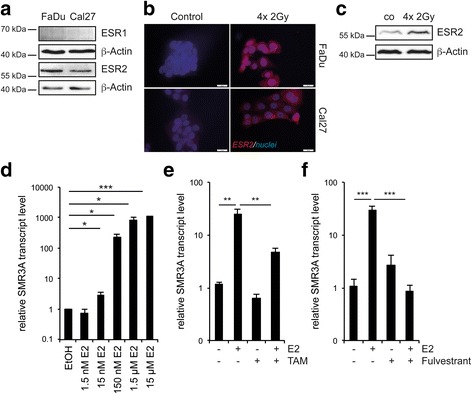
Fig. 2.

Regulation of SMR3A expression by ESR2 signaling. Western blot analysis revealed basal expression of ESR2 but not ESR1 protein in tumor cell lines (a) which was induced by fractionated IR as demonstrated by immunofluorescence staining b (red signal). Cell nuclei were counterstained with Hoechst H33342 (blue signal). Scale bars = 20 μm. Induced ESR2 protein expression after fractionated IR was confirmed in FaDu cells by Western blot analysis (c). Detection of β-Actin served as a control for protein quality and quantity. RQ-PCR revealed concentration dependent induction of relative SMR3A transcript levels by E2 in FaDu cells (d) which was impaired by administration of 1 μM TAM (e) or 10 nM Fulvestrant (f) respectively. Bars represent mean values ± SEM of at least two independent experiments measured in triplicates with quantification of LMNB1 transcript levels as reference gene. * p ≤ 0.05, *** p ≤ 0.0005
