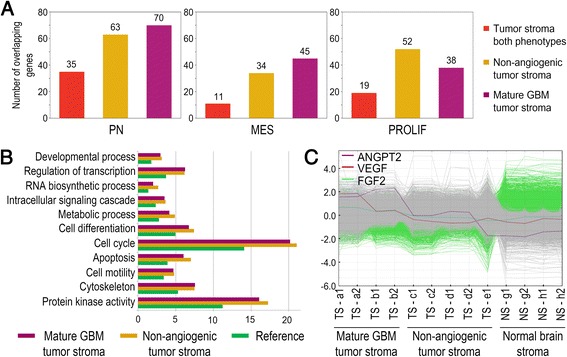
Fig. 4.

Gene ontology analysis of TAGs from non-angiogenic and mature GBM phenotypes. a Overlap between expression profiles of TAG populations as indicated and human subclasses of GBM. TAGs from both phenotypes combined displayed a significant overlap with both the proneural (p < 0.0001) and the proliferative (p < 0.0016) subclasses, but not the mesenchymal (p < 0.26) subgroup. Overlap between the individual TAG phenotypes and all the human GBM subclasses were highly significant (p < 0.0001). b The bar chart shows percentages of the genes ascribed to the biological processes indicated. All genes on the array chip were set as reference (green). The percentages of differentially expressed genes ascribed to these processes are significantly higher (Fisher’s exact test, p < 0.05 after Bonferroni correction) both in TAGs from non-angiogenic (yellow) and mature GBM phenotypes (purple). c Gene profiles of angiogenic factors significantly upregulated in TAGs from mature GBM phenotypes compared to TAGs from non-angiogenic tumour and normal glia. ANGPT2: Angiopoietin 2, VEGF: Vascular endothelial growth factor, FGF2: Fibroblast growth factor 2. PN: Proneural, MES: Mesenchymal, PROLIF: Proliferative
