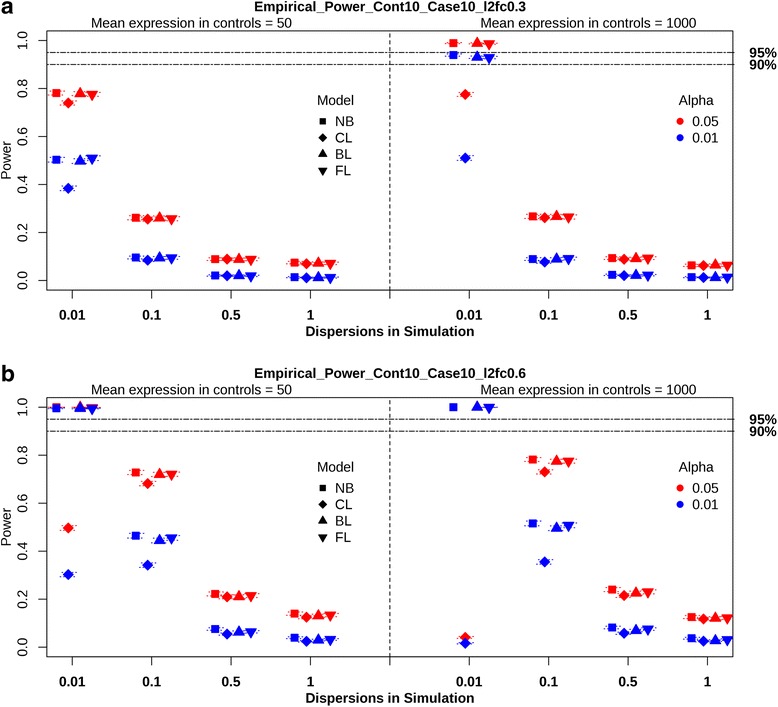
Fig. 1.

Empirical power of regression methods from the balanced design with N D=1 = 10. Power of the Negative Binomial with true dispersion (NB), Classic Logistic (CL), Bayes Logistic (BL), and Firth’s Logistic (FL) regressions at alpha levels of 0.05 and 0.01 are shown. The black dotted horizontal lines represent 95 and 90% power. Mean expression values (μ = 50 and 1000) are separated by black dotted vertical lines. Four dispersion values (0.01, 0.1, 0.5, and 1) are placed within each mean expression value. Dotted lines within each symbol imply 95% confidence interval. a The figure represents the results from the balanced design with N D=1 = 10 and log2fc = 0.3. b This figure shows the summary from the balanced design with N D=1 = 10 and log2fc = 0.6
