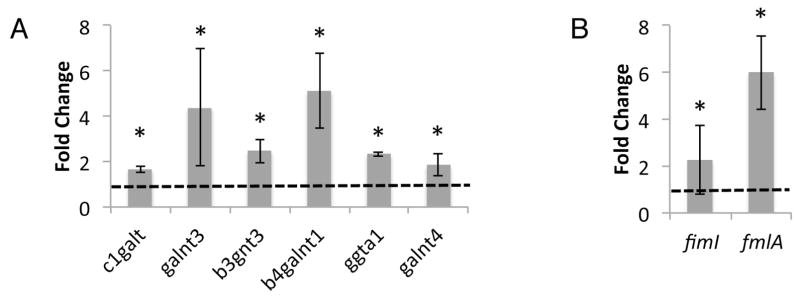
Figure 6. FmlH and FmlH receptor expression during UTI.
(A) qPCR of transcripts of selected Gal/GalNAc glycosylhydrolases, shown as fold change in chronically infected versus naïve bladders. (B) Measure of type 1 and F9 expression during chronic cystitis by qPCR of the representative pilus subunits fimI and fmlA, shown as fold change tissue associated versus the inoculum. Columns represent the mean and bars display standard deviation, n=5. Dotted line represents the (A) mock infected or (B) inoculum values. Asterisk denotes p<0.05 Wilcoxon Signed Rank test.

