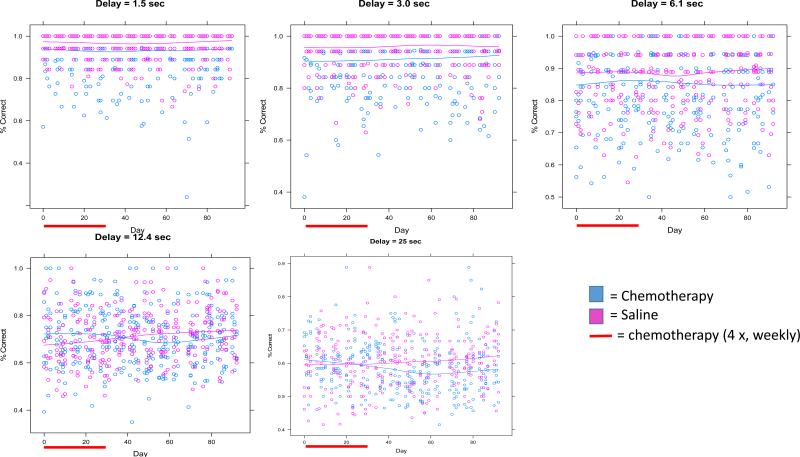
Figure 1. Percent Correct Across Delays.
Each figure represents the percent correct for each delay with each day of delayed spatial alternation. Individual data points represent individual mice..The red bar represents the period of chemotherapy or saline administration (1 × per week for each of 4 weeks). Lines represent fitted lines for chemotherapy-treated mice and controls. Significant effects between groups and group by time interactions are found at the 12.4 and 25 second delays as noted in the text.

