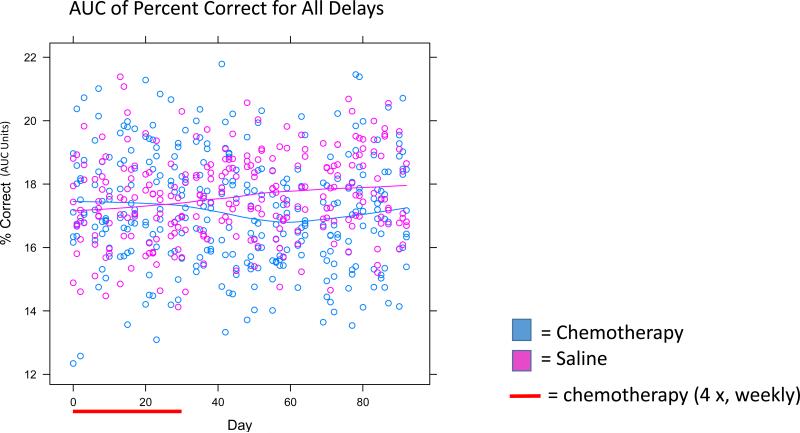
Figure 2. Area Under the Curve (AUC) Analysis for Percent Correct for All Delays.
All data points from Figure 1 were combined together to represent an AUC. Individual data points represent individual mice. Significant effects were seen between groups as noted in the text.

