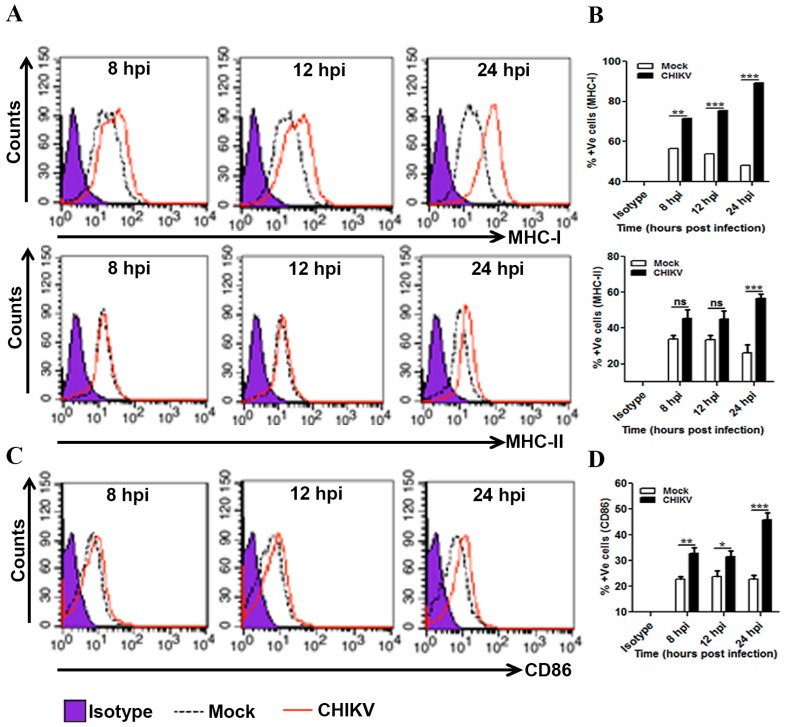
Figure 4.
Expression pattern of MHC and co-stimulatory molecules during CHIKV infection in macrophages. CHIKV infected Raw264.7 cells were harvested at different time intervals followed by flow cytometry based analysis. (A) MFI representing MHC-I (upper panel) and MHC-II (lower panel) expressions in isotype (purple filled), mock (black dashed line) and CHIKV infected macrophage (red solid line). (B) Bar diagram showing percent positive cells for MHC-I (upper panel) and MHC-II (lower panel) in mock (white bar) and CHIKV infected samples (dark bar) at 8, 12 and 24 hpi. (C) MFI representing CD86 expression in isotype (purple filled), mock (black dashed line) and CHIKV infected macrophage (red solid line). (D) Bar diagram showing percent positive cells for CD86 in mock (white bar) and CHIKV infected samples (dark bar) at 8, 12 and 24 hpi. Data represent Mean ± SEM of at least three independent experiments. p < 0.05 was considered as statistically significant difference between the groups. (ns, non-significant; * p ≤ 0.05; ** p ≤ 0.01; *** p ≤ 0.001).

