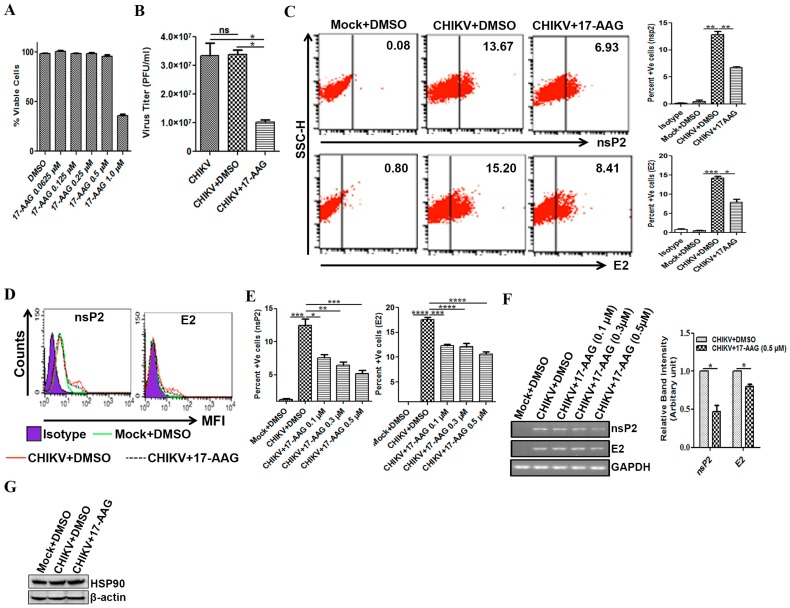
Figure 5.
Modulation of CHIKV infection by 17-AAG in macrophages. Raw cells were infected with CHIKV at MOI 5. The cells were treated with either DMSO or 17-AAG as described earlier. (A) Percent viable cells treated with different concentrations of 17-AAG with respect to the solvent control (DMSO) as determined by MTT assay. (B) Line diagram showing CHIKV titer as PFU/mL in CHIKV, CHIKV + DMSO and CHIKV + 17-AAG (0.5 µM) at 12 hpi. (C) Representative dot plot analysis depicting percent positive cells for nsP2 and E2 at 8 hpi. Bar diagram showing percent positive cells for nsP2 (upper panel) and E2 (lower panel) in different samples at 8 hpi. (D) MFI representing expression of nsP2 and E2 in isotype (purple filled), mock + DMSO (green solid line), CHIKV + DMSO (red solid line) and CHIKV + 17AAG (black dashed line) at 8 hpi. (E) Graphical representation showing percent positive cells for nsP2 (left) and E2 (right) at 0.1 µM, 0.3 µM and 0.5 µM 17-AAG treatments at 8 hpi. (F) Agarose gel picture showing RT-PCR of nsP2 and E2 (left) and bar diagram (right) showing reduction in the CHIKV RNA synthesis in Raw cells after 0.5 µM 17-AAG treatment at 8 hpi. (G) Representative Western blot showing HSP90 level for mock + DMSO, CHIKV + DMSO and CHIKV + 17-AAG at 8 hpi. Data represent mean ± SEM of at least three independent experiments. p < 0.05 was considered as statistically significant difference between the groups. (ns, non-significant; * p < 0.05; ** p ≤ 0.01; *** p ≤ 0.001).

