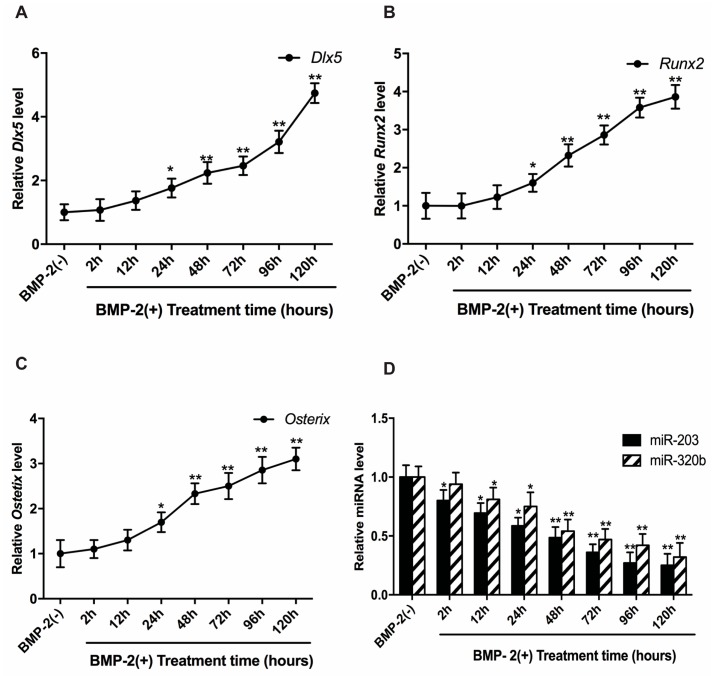
Figure 2.
Time course for the expression of Dlx5, Runx2, Osx and miR-203 and miR-320b. The time course shows an increase in the relative expression levels of: Dlx5 (A); Runx2 (B); and Osx (C) at the mRNA level in BMP-2 induced cells. A concomitant decrease in the miR-203 and miR-320b expression levels is seen in the cells treated with BMP-2 (D). Expression levels in cells untreated with BMP-2 were set to 1. All values are represented as mean ± S.D. of three independent experiments. Statistical significance is indicated as * p < 0.05 and ** p < 0.001.

