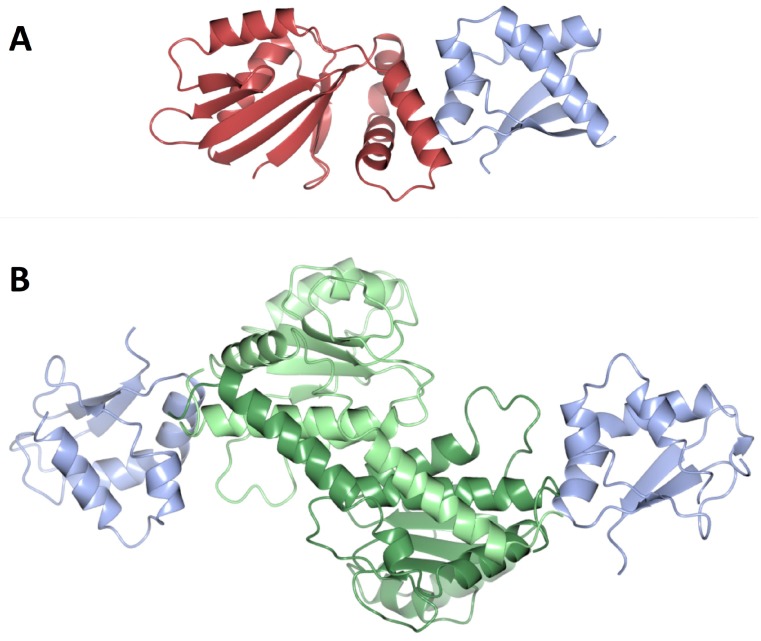
Figure 10.
(A) SirA–DnaA-DomainI structure (PDB code: 4TPS). SirA is shown in crimson, domain I of DnaA in blue; (B) HobA–DnaA-DomainI structure (PDB code: 2WP0). HobA is shown in green, domain I of DnaA in blue. HobA and SirA interact on equivalent surfaces of DnaA, despite exerting different regulatory effects.

