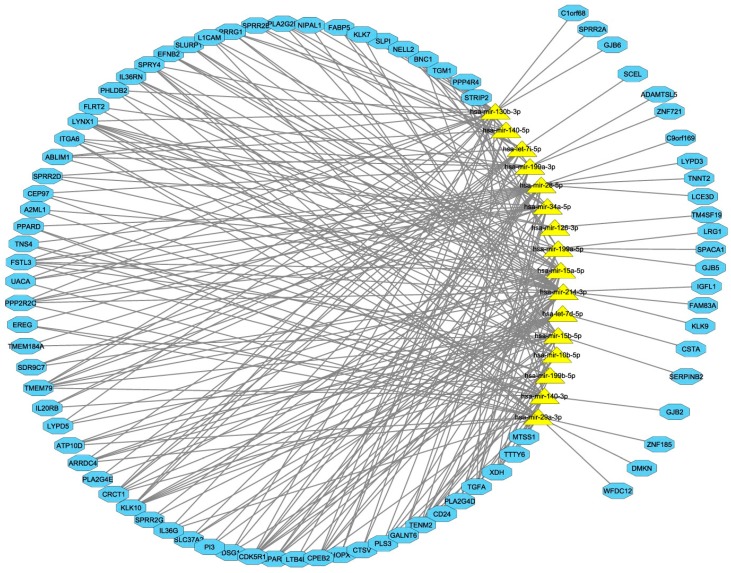
Figure 4.
Computational integration of genes and miRNAs by MAGIA2 bioinformatics tool: The network of anticorrelated miRNA genes was computed by rCCA and integrated by MAGIA2 tools with the information of target prediction derived from DIANA-microT, TargetScan, and microrna.org. Two hundred and forty-five interactions were found among 16 miRNAs and 84 genes. The Cytoscape tool was applied to display the interconnections between features. Yellow triangles indicate the miRNAs, and blue boxes indicate the genes. If it is predicted that a gene is to be targeted by at least two out of 16 miRNAs, this gene is located in the central ring, comprising the miRNAs. Otherwise, it is placed outside.

