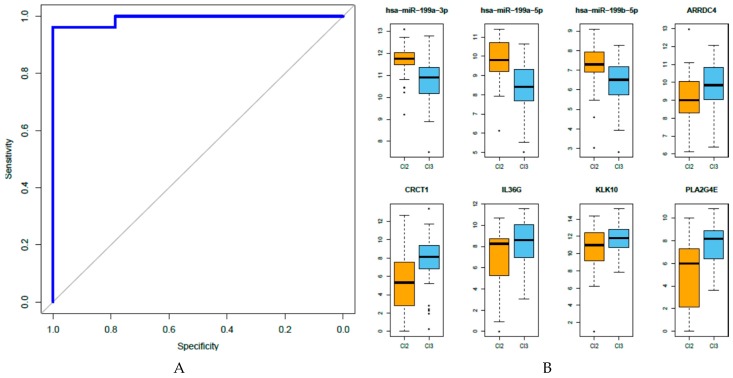
Figure 5.
(A) Performance of the eight miRNA–gene expression predictive model: The performance of our signature (blue line) in predicting PFS after cetuximab-CT treatment was tested in terms of sensitivity and specificity by ROC analysis (AUC = 0.992); (B) Analysis of the expression of the eight features entered in the miRNA-gene integrated signature in HNSCC TCGA data set: The tumors were stratified based on our six HNSCC subtypes [34] and miRNA and gene expression data were retrieved for the Cl2-mesenchymal (30 samples) and Cl3-hypoxia (59 samples) subtypes. A significant upregulation of hsa-miR-199a-3p, hsa-miR-199a-5p, and hsa-miR-199b-5p in Cl2 (p = 7.25E-05, p = 3.8E-06, p = 0.0019, respectively) and of ARRDC4, CRCT1, IL36G, KLK10, and PLA2G4E in Cl3 (p = 0.021, p = 4.66E-05, p = 0.00199, p = 0.0135, p = 2.42E-06, respectively) was observed.

