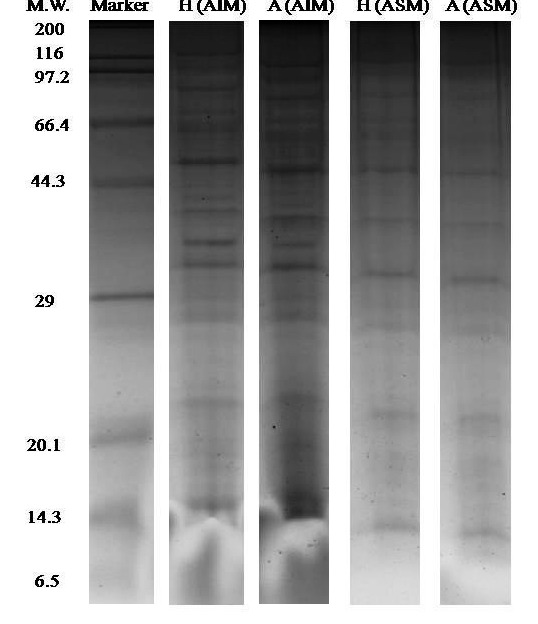
Figure 1.

One-dimensional gel electrophoresis (1-DE SDS PAGE) results of the shell OMPs analysis. The first lane represents the marker bands while the second, third, fourth and fifth lanes of H (AIM), A (AIM), H (ASM) and A (ASM) represent the shell proteins bands where H: C. hongkongensis and A: C. angulata.
