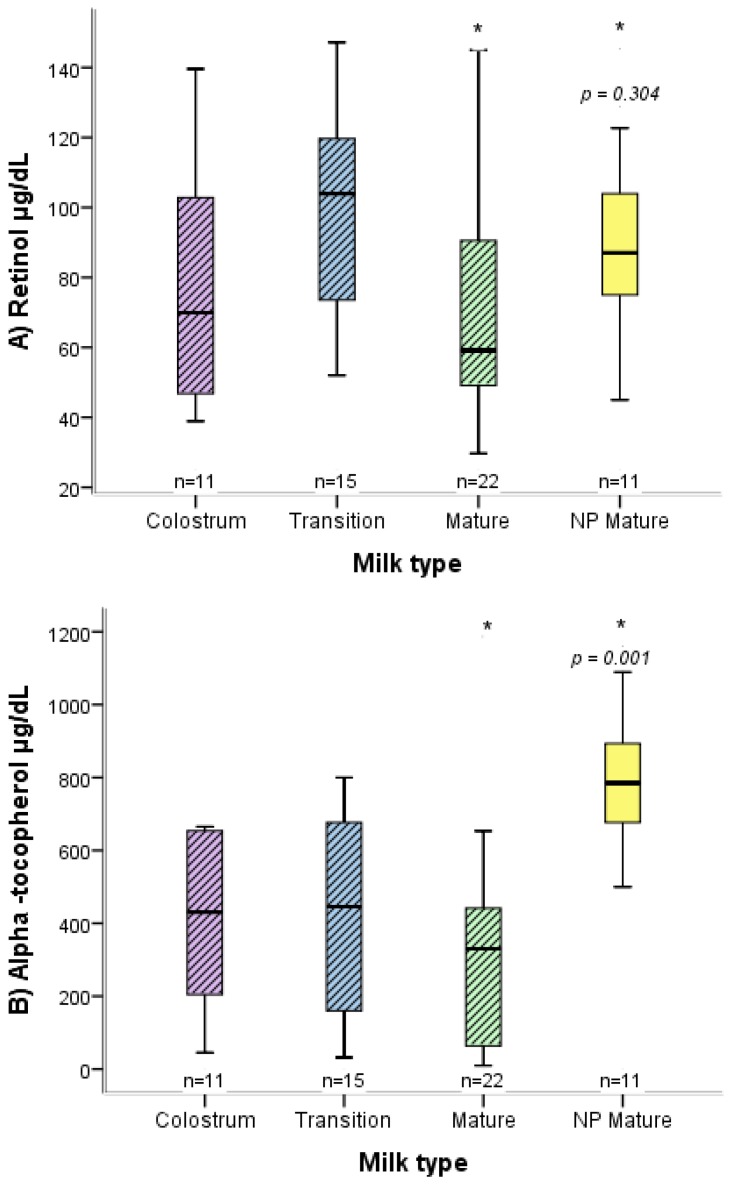
Figure 1.
Box plot distribution of the concentration of retinol (A) and α-tocopherol (B) in breast milk, comparing the women with a full-term, high-risk pregnancy to those with a normal pregnancy. For the high-risk pregnancy, the distinct types of breast milk are shown (colostrum, transition milk, and mature milk). * p; Mann-Whitney U. The bottom and top of the box represent the first and third quartiles (IQR), and the band inside the box the median. The ends of the whiskers denote the lowest and highest values still within 1.5 IQR. Outlier values are not displayed. NP, normal pregnancy.

