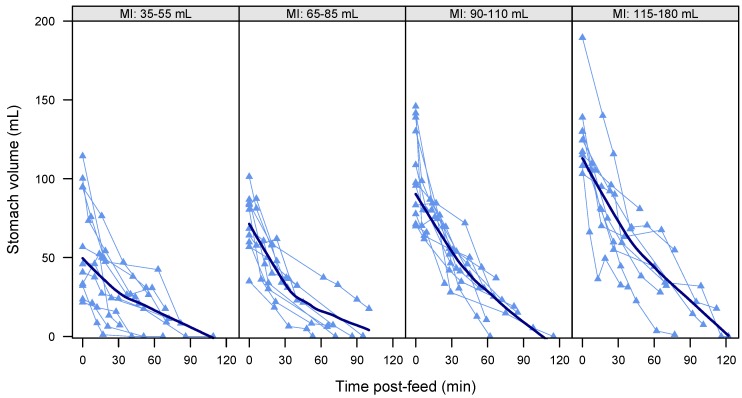
Figure 3.
Gastric emptying of individual feeds in term breastfed infants (n = 41 feeds). Feeds are grouped by milk intake (MI) to illustrate the effect of the feed volumes; approximately equal numbers are included in each panel. Data points represent stomach volumes calculated from ultrasound images; connecting lines link measurements from the same feed. Bold line represents local regression smoother (LOESS, span = 0.9).

