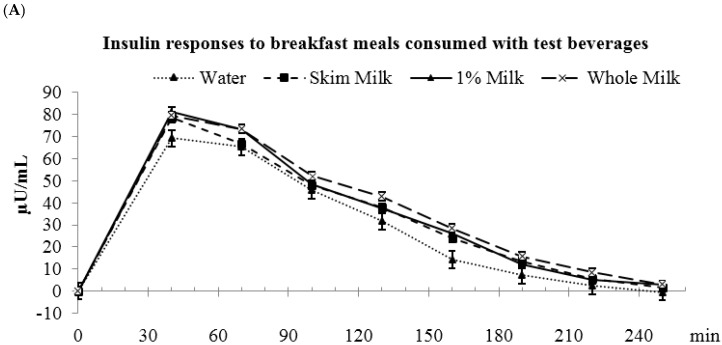
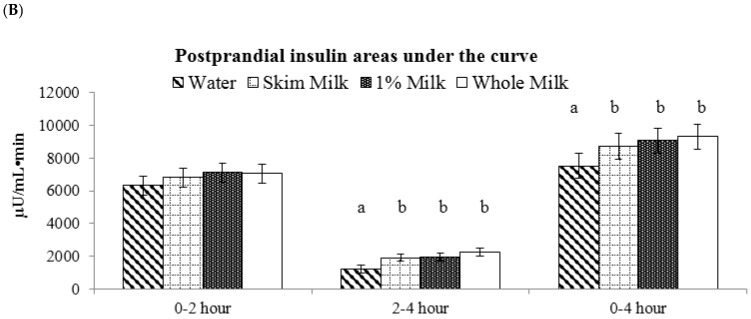
Figure 5.
Postprandial plasma insulin responses to breakfast meals consumed with test beverages. (A) Changes in insulin concentrations during meal glucose tolerance tests; (B) Insulin incremental area under the curve. a,b Bars with different letters (during the same time frame) were significantly different, p < 0.05.


