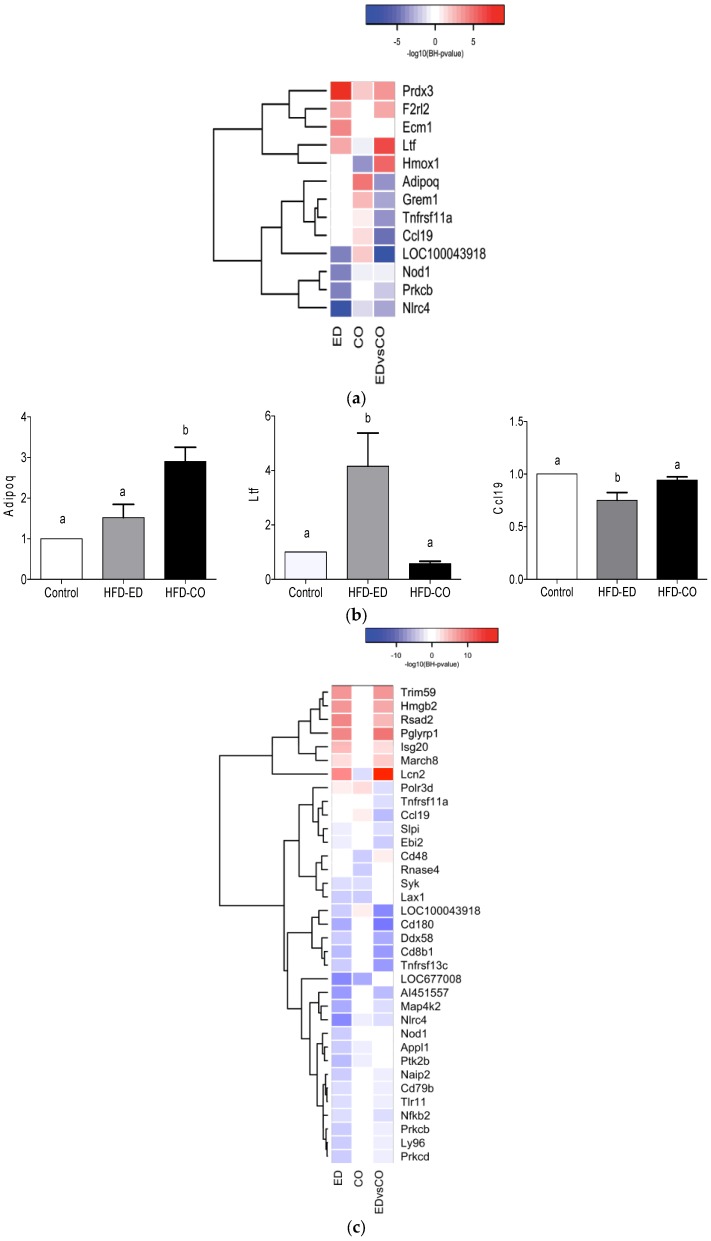
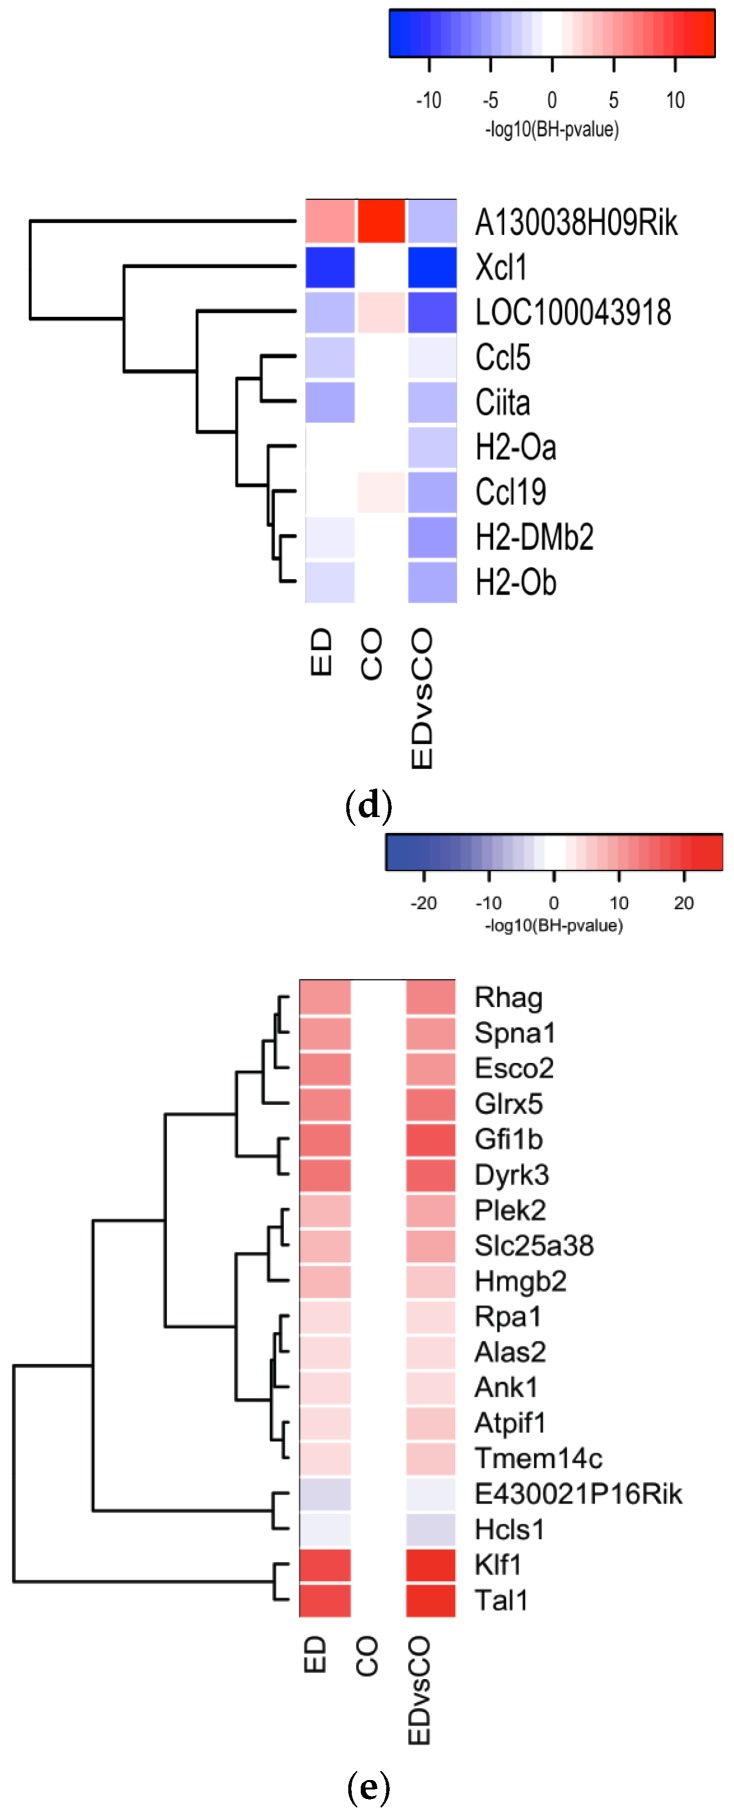
Figure 2.
Heat map showing gene-expression patterns for any diet comparison i.e., HFD-ED vs. control; HFD-CO vs. control; HFD-ED vs. HFD-CO. for atleast one comparison BH-p value < 0.001 was considered significant. (a) Heat map showing group of genes regulated in NF-κB regulation, in BP GO:0043123 positive regulation of I-κB kinase/NF-κB signaling, BP GO:0051092 positive regulation of NF-κB transcription factor activity, and BP GO:0042346 positive regulation of NF-κB import into nucleus; (b) Relative expression of different genes involved in modulation of NF-κB in mouse spleen. Each gene is normalized against the house-keeping gene Ubiquitin (Ubc), and expression level shown as relative to the control diet; (c) Heat map showing groups of genes regulated in immune-related processes, including BP GO:0045087 innate immune response, BP GO:0002250 adaptive immune response, BP GO:0006959 humoral immune response, BP GO:0016064 immunoglobulin mediated immune response, BP GO:0001771 immunological synapse formation, BP GO:0042116 macrophage activation, BP GO:0002224 toll-like receptor signaling pathway, and BP GO:0002755 MyD88-dependent toll-like receptor signaling pathway; (d) Heat map showing groups of genes regulated in interferon-gamma regulation, including BP GO:0060333 interferon gamma mediated signaling pathway, BP GO:0019882 antigen processing and presentation, and BP GO:0071346 cellular response to interferon-gamma; (e) Heat map showing groups of genes regulated in erythrocyte turnover, including BP GO:0030218erythrocyte differentiation, BP GO:0048821 erythrocyte development, BP GO:0045648 positive regulation of erythrocyte differentiation, BP GO:0030097 hemopoieses, and BP GO:0002244 hematopoietic progenitor cell differentiation.


