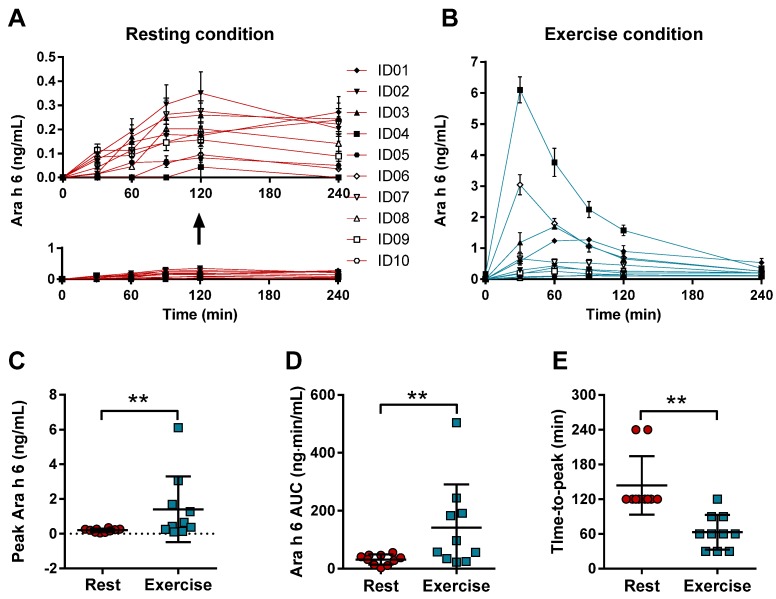
Figure 2.
Ara h 6 levels in serum after peanut intake following rest or exercise. Serum levels of Ara h 6 (Mean ± standard deviation) was measured 30, 60, 90, 120, and 240 min after the consumption of 100 g of peanuts. This intake was followed by rest (A, red lines) or by exercise (60 min of cycling at 70% Wmax) (B, blue lines). For both conditions, individual peak levels (C), area under the curve (AUC) (D), and time-to-peak (E) were determined for rest (red circle) and exercise (blue square). ID represents an individual * represents a p-value < 0.05; ** represents a p-value < 0.01.

