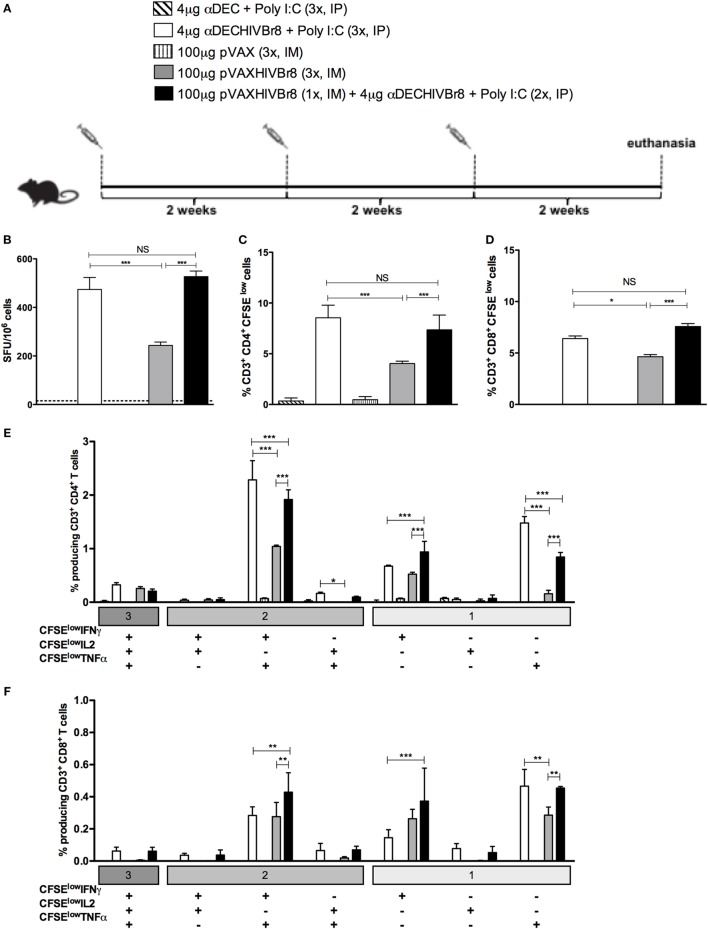
Figure 5.
The chimeric αDECHIVBr8 monoclonal antibody (mAb) is more immunogenic even with increased doses of the DNA vaccine. BALB/c mice (n = 6) were immunized with three doses of 4 µg of αDECHIVBr8 in the presence of poly (I:C) adjuvant (IP) or three doses of 100 µg of pVAXHIVBr8 DNA vaccine (IM). For heterologous regimens, mice were immunized with one dose of DNA vaccine followed by two doses of the chimeric mAb. (A) Immunization scheme. Fifteen days after the second dose, the spleen of each animal was removed and the splenocytes (B) were cultured in the presence of pooled HIV-1 peptides (5 µM) for 18 h to evaluate the number of IFN-γ-producing cells by ELISpot assay. SFU, spot forming units. Cutoff = 15 SFU/106 cells and is represented by the dotted line. (C,D) Splenocytes were labeled with carboxyfluorescein succinimidyl ester (CFSE) (1.25 µM) and cultured in the presence of pooled HIV-1 peptides (5 µM) for 5 days to evaluate specific proliferation. After staining with fluorochrome-labeled anti-CD3, anti-CD4, and anti-CD8 monoclonal antibodies, cells were analyzed by flow cytometry. CFSE dilution on gated CD3+CD4+ (C) or CD3+CD8+ (D) cells was used as readout for antigen-specific proliferation. For detection of cytokine-producing T cells, cells were pulsed on day 4 for 12 h with pooled peptides in the presence of anti-CD28 and brefeldin A. Cells were then surface stained with anti-CD3, CD4, and CD8, permeabilized, and stained for intracellular cytokines. Multiparameter flow cytometry was used to determine the frequency of IFNγ-, IL2-, or TNFα-producing CD4+ and CD8+ T cells (E,F). After gating on proliferating (CFSElow) and cytokine-producing cells, Boolean combinations were then created using FlowJo software to determine the frequency of each response based on all possible combinations of cytokine-producing CD4+ (E) and CD8+ (F) T cells. One million events were acquired in a live lymphocyte gate. The percent of proliferating CD4+ and CD8+ CFSElow cells was determined in the CD3+ cell population. The percentage of proliferating and cytokine-producing T cells was calculated subtracting the values of stimulated from non-stimulated cultures. NS, not significant; *p < 0.05; **p < 0.01; ***p < 0.001. Data represent mean ± SD.

