
Figure 3.
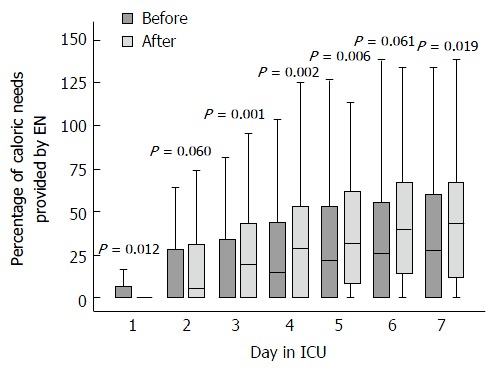
Percentage of caloric needs provided by enteral feeding before and after implementation of feeding protocol. The boxes represent interquartile range (a median value is marked with a line) and error bars 95%CI. EN: Enteral feeding.
Official websites use .gov
A
.gov website belongs to an official
government organization in the United States.
Secure .gov websites use HTTPS
A lock (
) or https:// means you've safely
connected to the .gov website. Share sensitive
information only on official, secure websites.
Percentage of caloric needs provided by enteral feeding before and after implementation of feeding protocol. The boxes represent interquartile range (a median value is marked with a line) and error bars 95%CI. EN: Enteral feeding.