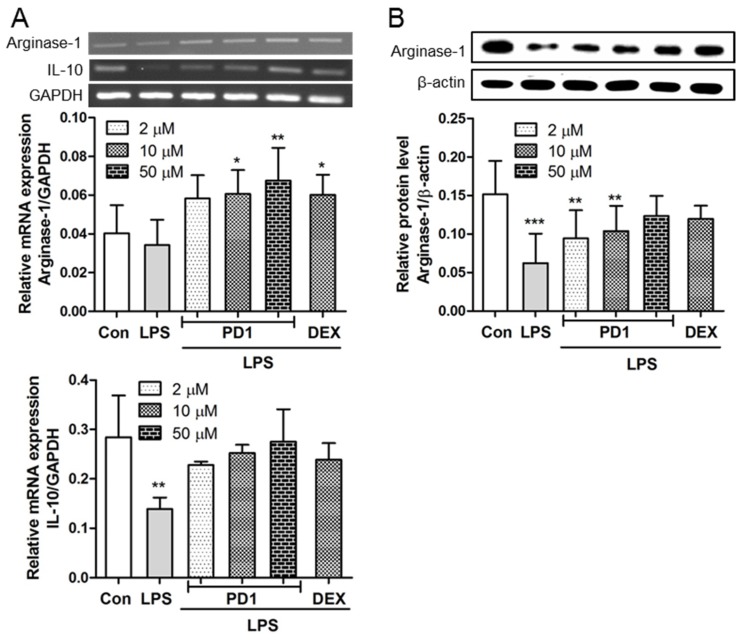
Figure 6.
RT-PCR results for anti-inflammatory genes (A) and Western blot results for the protein expression of arginase-1 (B). RAW264.7 cells pre-treated with the indicated concentrations PD1 or dexamethasone (DEX) for 1 h and then treated with LPS (10 ng/mL, 1 h) for RT-PCR, or with LPS (1 μg/mL, 24 h) for Western blot. GAPDH and β-actin were used as internal references, respectively. The results shown are representative of three independent experiments. * p < 0.05, ** p < 0.01, and *** p < 0.001 vs. untreated controls.

